Today’s infographic from McKinsey Global Institute (MGI) presents a snapshot of 10 insights into how the world is changing, based on its research work from 2019. How did we get here, and where are we going?
A Connected World in Flux
Globalization is making the world “shrink” every day, as humans and trade become increasingly connected. However, there are signs that point to a new phase of globalization that is leading to different outcomes than prior years.
1. Globalization in Transition
Global exports are fundamentally shifting. Although manufactured goods are traded at higher volumes, certain services have grown up to three times faster. The compound annual growth rate (CAGR, 2007-2017) for different sectors are as follows: This has a profound impact on the mix of industries and countries involved in this shift away from goods and towards services. Asia is coming of age in this phase of the global economy.
2. Asia’s Ascent
Trade with and within Asia is rising, and shows no signs of slowing down. The region’s economic might is growing rapidly, and with higher disposable incomes, consumption is growing too. In China, there is a new dynamic at play.
3. China’s Changing Relationships
Compared to other developed nations, China’s economy is relatively closed. The country is re-balancing its focus towards domestic consumption and relying less on other countries for trade, technology, and capital. At the same time, the rest of the world is increasingly exposed and tied to China for the same things—and such unequal engagement has a ripple effect on everything from financial markets to flows of technology and innovation.
Technology and the Future of Work
New technologies like artificial intelligence are sparking new opportunities, but they also raise questions about the future of work across geographies and gender.
4. Increasingly Digital India
As the costs of devices and data plummet, India’s digital adoption is surging—it closely competes with China for the highest digital population across everything from smartphone ownership to social media users. As mass adoption of digital technologies continues, it is poised to add significant economic value to the Indian economy. Companies worldwide are also integrating new technologies—changing the nature of work itself.
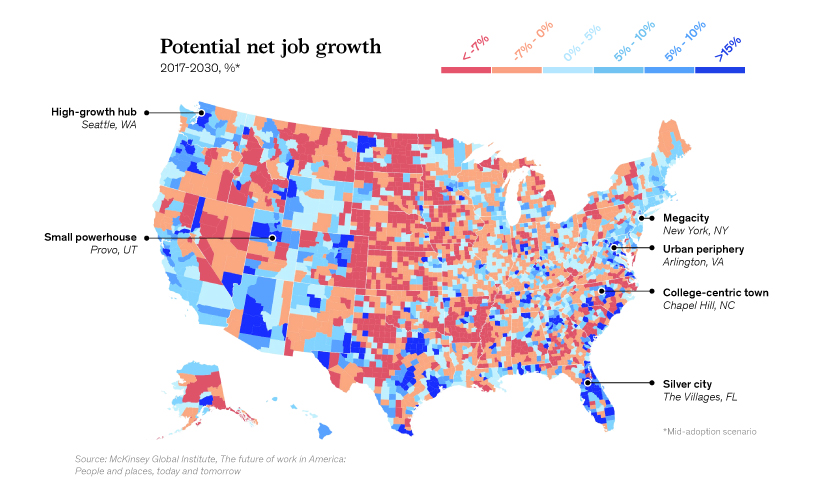
5. New Geography of Work
By 2030, talent and investment in the U.S. will be concentrated in a few regions—with 60% of job growth coming from just 25 hubs. These are just some examples of places which see double-digit potential net job growth by 2030. However, all regions will face unique challenges in the next decade.
6. Automation’s Effect on Gender at Work
Globally, women and men are at similar risk of losing their jobs to automation by 2030.
Women: 107 million FTEs Share of female employment, 2017: 20% Men: 163 million FTEs Share of male employment, 2017: 21%
*FTE: full time equivalent. Based on midpoint automation scenario. While everyone needs to adapt in the age of automation, women face more barriers. They spend up to 1.1 trillion hours on unpaid care work, nearly three times that of men (400 billion hours). Women are also often in lower-paid roles or male-dominated professions. Additionally, many women have less access to digital technology, and limited flexibility to pursue education. These factors make it harder for women to “catch up” and bridge the gap left behind by automation.
Inequalities and Uncertainties
It’s clear that while technology generates opportunities, it also creates new social challenges. Low- and middle-income households face stagnating incomes, higher debt, and rising basic costs.
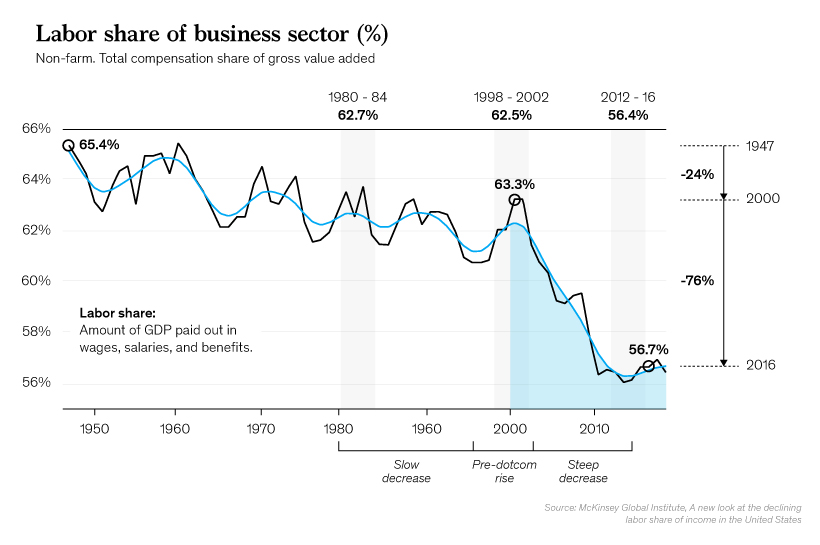
7. Declining Labor Share of Income
The U.S. labor share of income has been dropping for years—but ¾ of this decline has occurred since 2000. According to McKinsey Global Institute, boom-bust commodity cycles and rising depreciation are the main factors behind this trend, more so than commonly-cited automation or globalization. Stagnating incomes mean less purchasing power, while the cost of basics are sharply rising.
8. Changing Consumption Costs
The global inequality gap has narrowed, but within developed economies, it has actually increased. Technology and globalization have made many discretionary goods cheaper. However, basic costs such as education, housing, and healthcare have ballooned compared to the rate of inflation over the past decade. With wages stagnating, the higher costs for basics have eaten into disposable incomes in many mature economies.
A Changing Business World
Global trends drastically influence how companies compete with one another, transforming corporate dynamics worldwide.
9. Corporate Superstars
In just two decades, the distribution of economic profits has been growing increasingly wider. The top 10% of companies (>$1 billion in revenue) brings in an ever-larger share of total profits, while the losses of the bottom 10% share deepen.
Average profit per company, 1995-1997 Top 10%: $0.85B Bottom 10%: -$1.02B Average profit per company, 2014-2016 Top 10%: $1.36B Bottom 10%: -$1.56B
*In 2016 dollars. Considers corporations with ≥$1 billion average sales (inflation-adjusted). Sample sizes: 2,450 companies (1996–1997) and 5,750 companies (2014–2016). In essence, the bottom 10% destroy as much value as the top 10% create—and it has only intensified in 20 years.
10. Latin America’s Missing Middle
Latin America best exemplifies this corporate trend of companies “thriving” versus “surviving”. Compared to similar economies, Latin American countries lack mid-size companies with over $50M in revenue. The Latin American average for firms per $1T GDP is 65 firms, while 100 firms is the benchmark average. While Asia’s share of the largest firms is widely distributed across countries, Latin American enterprises are lagging behind.
What does the Future Hold?
CEOs and leaders will need to adapt to the new age of disruption—and quickly. To become a 21st century company, they must ask 10 crucial questions about how they operate in an increasingly complex world: As the 10 insights suggest, global trends are profoundly altering the course of our future. Their impact varies greatly depending on demographics and region. Everyone—business leaders, policy makers, and individuals worldwide—will need to adapt to the realities of a world in transformation. on Last year, stock and bond returns tumbled after the Federal Reserve hiked interest rates at the fastest speed in 40 years. It was the first time in decades that both asset classes posted negative annual investment returns in tandem. Over four decades, this has happened 2.4% of the time across any 12-month rolling period. To look at how various stock and bond asset allocations have performed over history—and their broader correlations—the above graphic charts their best, worst, and average returns, using data from Vanguard.
How Has Asset Allocation Impacted Returns?
Based on data between 1926 and 2019, the table below looks at the spectrum of market returns of different asset allocations:
We can see that a portfolio made entirely of stocks returned 10.3% on average, the highest across all asset allocations. Of course, this came with wider return variance, hitting an annual low of -43% and a high of 54%.
A traditional 60/40 portfolio—which has lost its luster in recent years as low interest rates have led to lower bond returns—saw an average historical return of 8.8%. As interest rates have climbed in recent years, this may widen its appeal once again as bond returns may rise.
Meanwhile, a 100% bond portfolio averaged 5.3% in annual returns over the period. Bonds typically serve as a hedge against portfolio losses thanks to their typically negative historical correlation to stocks.
A Closer Look at Historical Correlations
To understand how 2022 was an outlier in terms of asset correlations we can look at the graphic below:
The last time stocks and bonds moved together in a negative direction was in 1969. At the time, inflation was accelerating and the Fed was hiking interest rates to cool rising costs. In fact, historically, when inflation surges, stocks and bonds have often moved in similar directions. Underscoring this divergence is real interest rate volatility. When real interest rates are a driving force in the market, as we have seen in the last year, it hurts both stock and bond returns. This is because higher interest rates can reduce the future cash flows of these investments. Adding another layer is the level of risk appetite among investors. When the economic outlook is uncertain and interest rate volatility is high, investors are more likely to take risk off their portfolios and demand higher returns for taking on higher risk. This can push down equity and bond prices. On the other hand, if the economic outlook is positive, investors may be willing to take on more risk, in turn potentially boosting equity prices.
Current Investment Returns in Context
Today, financial markets are seeing sharp swings as the ripple effects of higher interest rates are sinking in. For investors, historical data provides insight on long-term asset allocation trends. Over the last century, cycles of high interest rates have come and gone. Both equity and bond investment returns have been resilient for investors who stay the course.