Over two centuries of burning fossil fuels have added up, and global decision-makers and business leaders are focusing in on carbon emissions as a key issue.
Emissions by Country
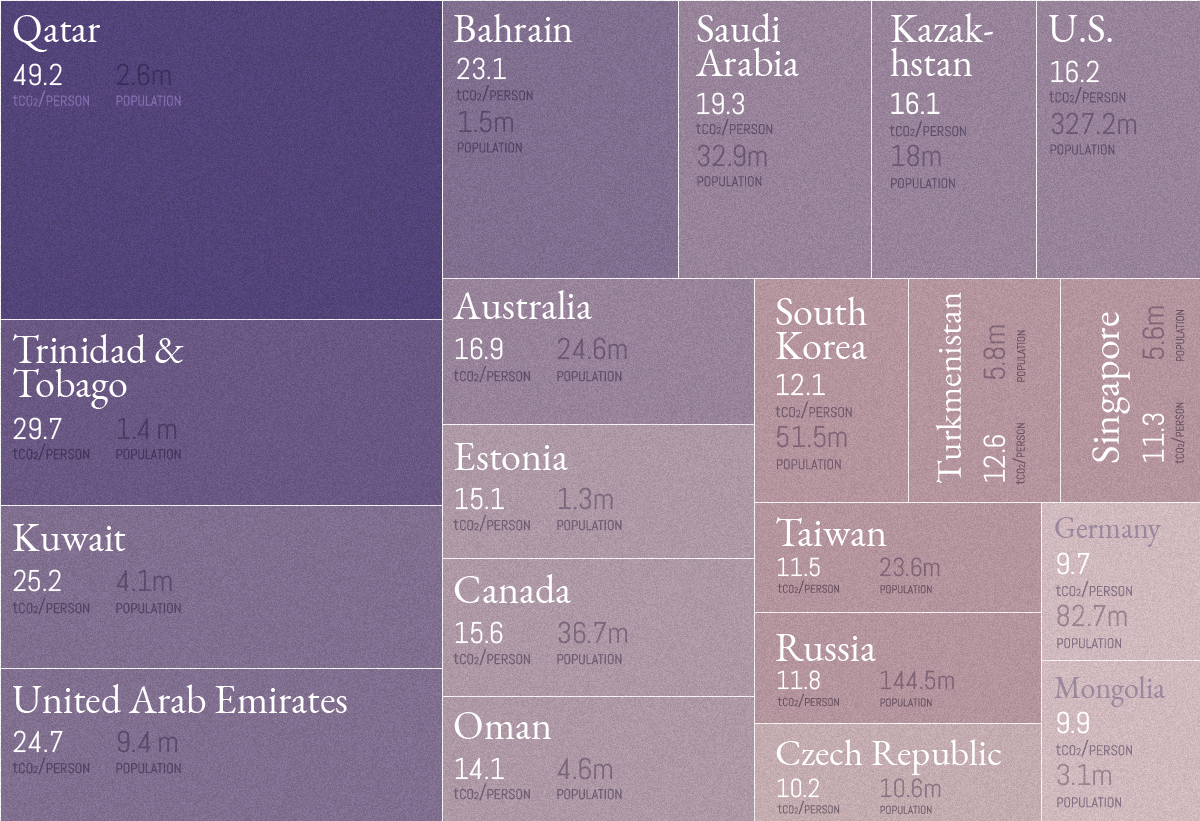
This week’s chart uses the most recent data from Global Carbon Atlas to demonstrate where most of the world’s CO₂ emissions come from, sorted by country. In terms of absolute emissions, the heavy hitters are immediately obvious. Large economies such as China, the United States, and India alone account for almost half the world’s emissions. Zoom out a little further, and it’s even clearer that just a handful of countries are responsible for the majority of emissions. Of course, absolute emissions don’t tell the full story. The world is home to over 7.5 billion people, but they aren’t distributed evenly across the globe. How do these carbon emissions shake out on a per capita basis? Here are the 20 countries with the highest emissions per capita: Source: Global Carbon Atlas. Note: We’ve only included places with a population above one million, which excludes islands and areas such as Curaçao, Brunei, Luxembourg, Iceland, Greenland, and Bermuda. Out of the original 30 countries in the main visualization, six countries show up again as top CO₂ emitters when adjusted for population count: Saudi Arabia, the United States, Canada, South Korea, Russia, and Germany.
The CO₂ Conundrum
We know that rapid urbanization and industrialization have had an impact on carbon emissions entering the atmosphere, but at what rate? Climate data scientist Neil Kaye answers the question from a different perspective, by mapping what percentage of emissions have been created during your lifetime since the Industrial Revolution: Put another way, the running total of emissions is growing at an accelerating rate. This is best seen in the dramatic shortening between the time periods taken for 400 billion tonnes of CO₂ to enter the atmosphere:
First period: 217 years (1751 to 1967) Second period: 23 years (1968 to 1990) Third period: 16 years (1991 to 2006) Fourth period: 11 years (2007 to 2018)
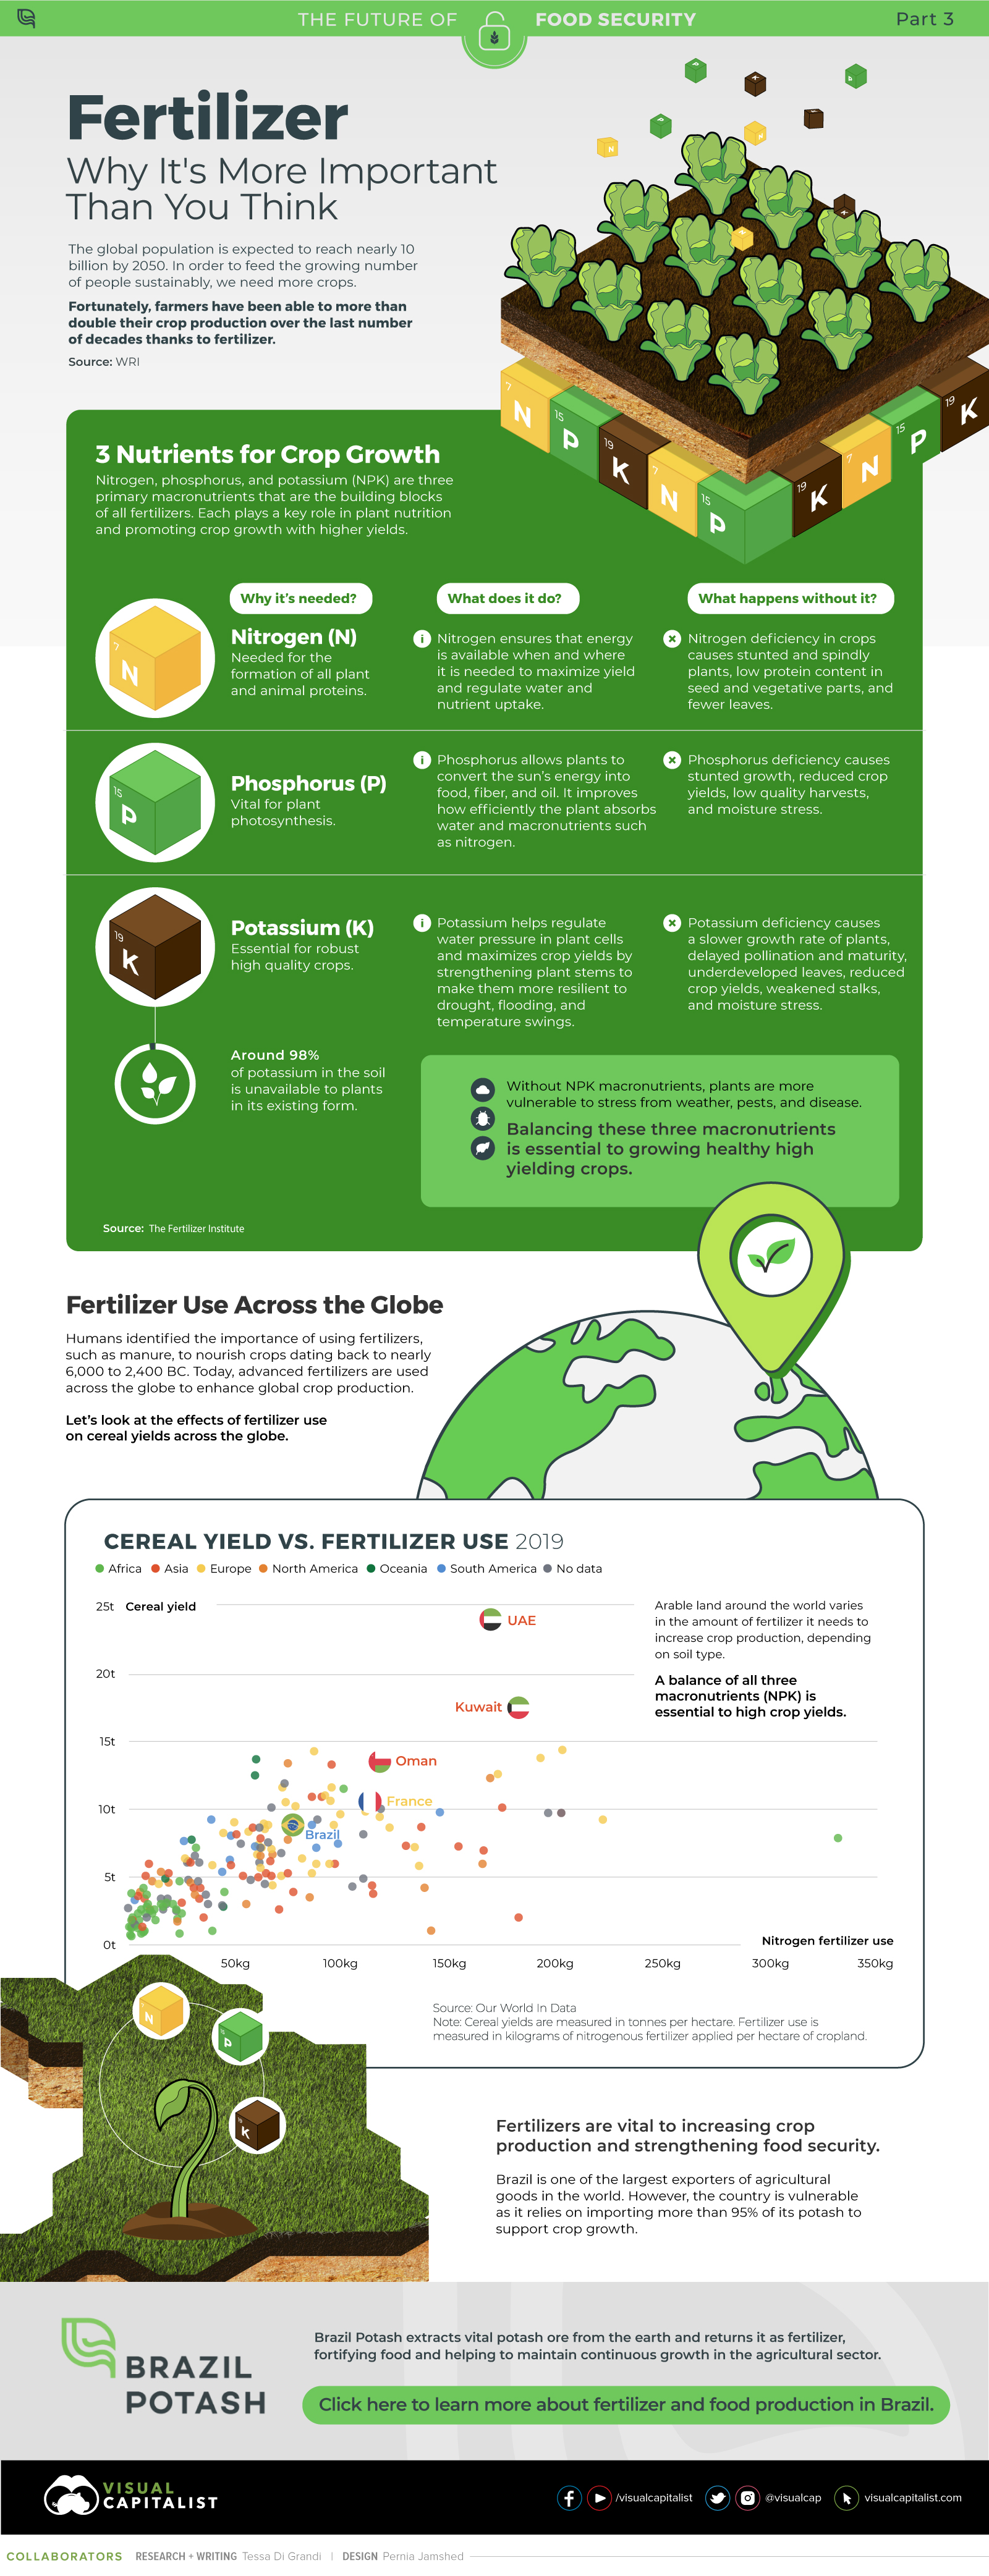
— Christiana Figueres, Convenor of Mission 2020 on Over recent decades, farmers have been able to more than double their production of crops thanks to fertilizers and the vital nutrients they contain. When crops are harvested, the essential nutrients are taken away with them to the dining table, resulting in the depletion of these nutrients in the soil. To replenish these nutrients, fertilizers are needed, and the cycle continues. The above infographic by Brazil Potash shows the role that each macronutrient plays in growing healthy, high-yielding crops.
Food for Growth
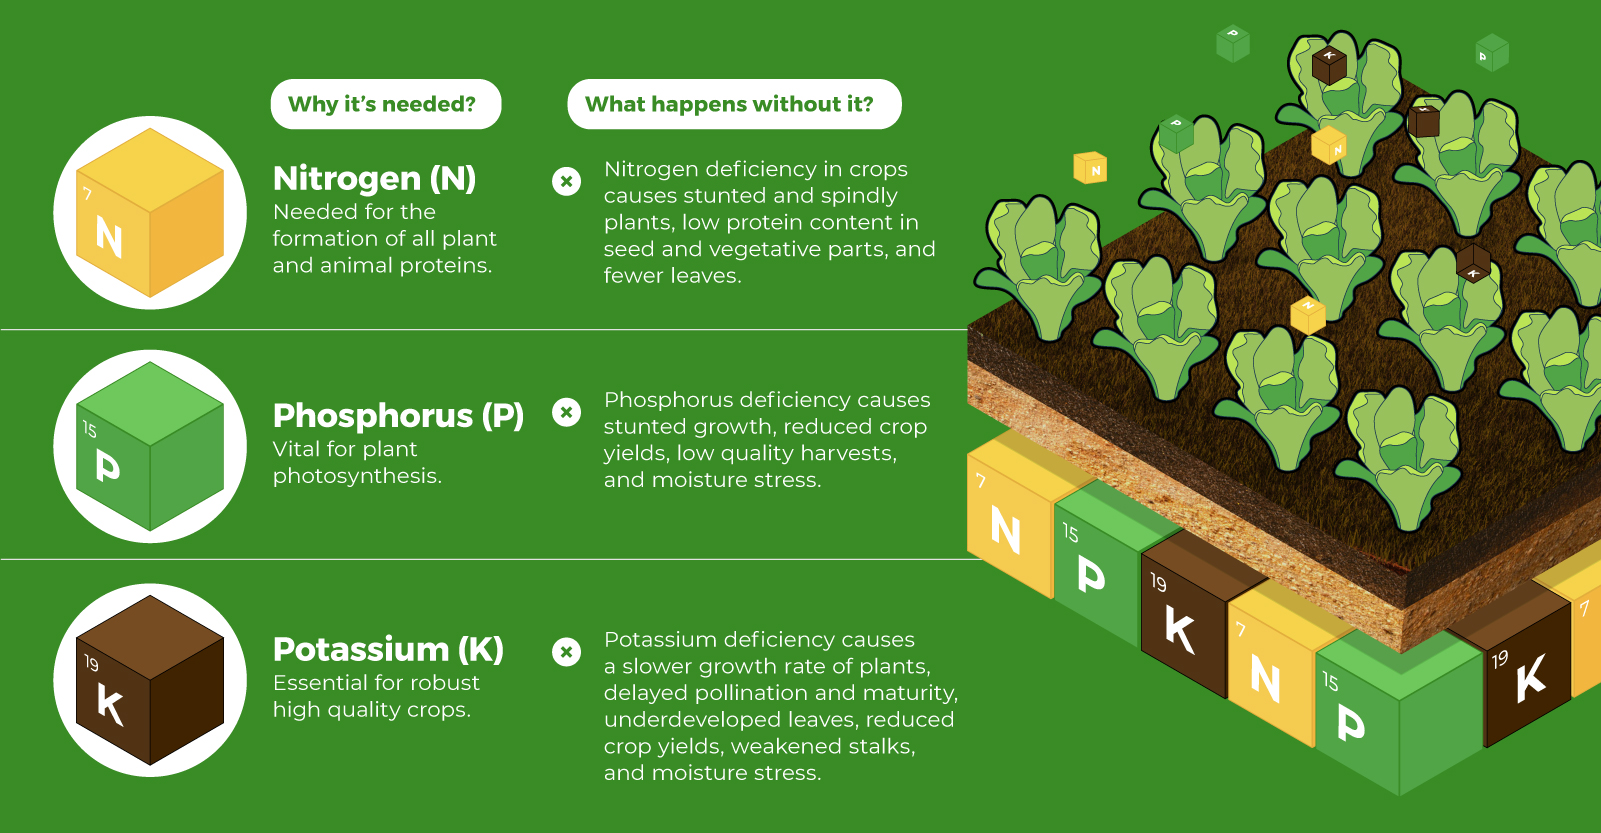
Nitrogen, phosphorus, and potassium (NPK) are three primary macronutrients that are the building blocks of the global fertilizer industry. Each plays a key role in plant nutrition and promoting crop growth with higher yields. Let’s take a look at how each macronutrient affects plant growth. If crops lack NPK macronutrients, they become vulnerable to various stresses caused by weather conditions, pests, and diseases. Therefore, it is crucial to maintain a balance of all three macronutrients for the production of healthy, high-yielding crops.
The Importance of Fertilizers
Humans identified the importance of using fertilizers, such as manure, to nourish crops dating back to nearly 6,000 to 2,400 BC. As agriculture became more intensive and large-scale, farmers began to experiment with different types of fertilizers. Today advanced chemical fertilizers are used across the globe to enhance global crop production. There are a myriad of factors that affect soil type, and so the farmable land must have a healthy balance of all three macronutrients to support high-yielding, healthy crops. Consequently, arable land around the world varies in the amount and type of fertilizer it needs. Fertilizers play an integral role in strengthening food security, and a supply of locally available fertilizer is needed in supporting global food systems in an ever-growing world. Brazil is one of the largest exporters of agricultural goods in the world. However, the country is vulnerable as it relies on importing more than 95% of its potash to support crop growth. Brazil Potash is developing a new potash project in Brazil to ensure a stable domestic source of this nutrient-rich fertilizer critical for global food security. Click here to learn more about fertilizer and food production in Brazil.