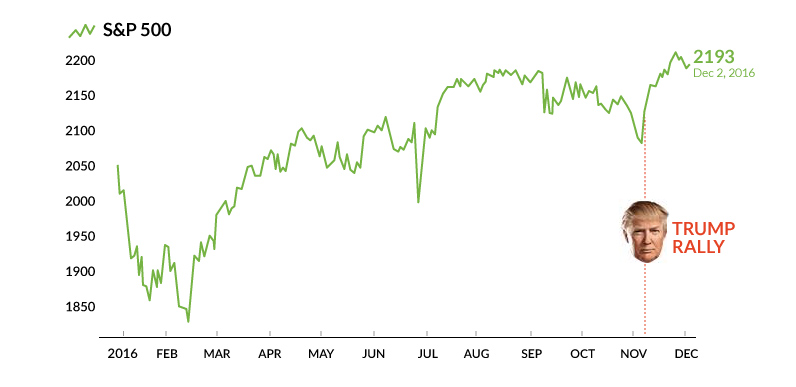
Over the course of the year, U.S. markets have hit new all-time highs on multiple occasions. The most recent iteration of this trend is the “Trump Rally”, which has the S&P 500 up 2.8% since Election Day.
Fueled by expansionary monetary policy and the lowest interest rates in history, the bull market in U.S. equities is now the second-longest of all time. It’s hard to believe that almost eight years ago, the S&P 500 sat at a measly low of just 676.53 on March 9, 2009.
Rising Portfolios, Declining Participation
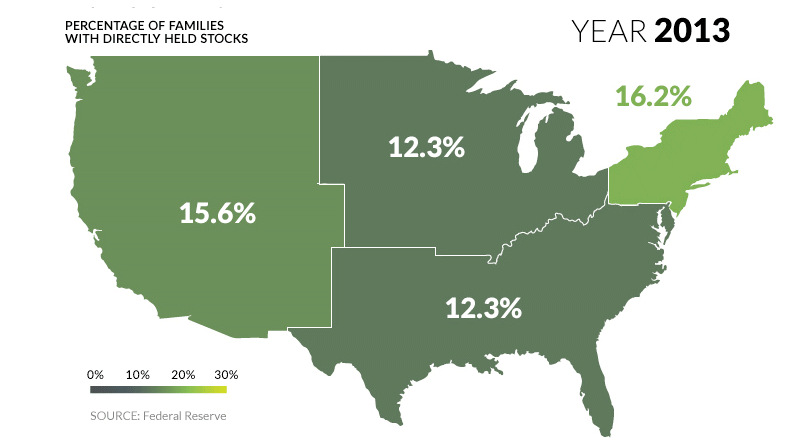
The stock market is proven to be the best way for investors to make returns over the long run, even through recessions and other catastrophic events. This can be seen on the below map, showing portfolio value on a regional basis from 1989-2013:
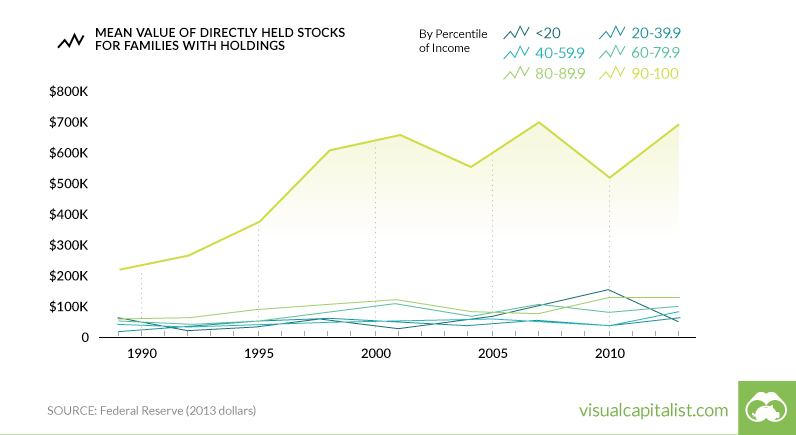
This data, which comes from the Fed every three years, shows the mean value of stocks for families that have holdings in the market. The most recent national number is $294,300 for 2013, and we can safely assume that mean portfolio values are even higher today given the continuation of the bull market. But does this mean that everyone has benefited from rising stock prices? While the average value of stocks held by families has soared, there is an alarming countertrend: the percentage of families that actually own stocks has been shrinking since 2001:
One particularly interesting regional case is that of the Midwest. In the span of nine years (from 2004-2013) the percentage of families with stock ownership halved from 23.4% to 12.3%. But this has also happened on a broader level. The percentage of families nationwide with directly-owned stocks peaked at 21.3% in 2001 – and since then, the number has consistently declined all the way until 2013, when only 13.8% of families owned stocks.
What Does It Mean?
Despite steady market gains since 2009, fewer families are participating in the markets. Is it that people don’t have enough disposable income anymore to invest? Or is this because families are still skeptical of the economy and market even years after the 2008 crisis? Regardless of the reasons, stock market gains have gone predominantly to one group of people:
The 90-100% percentile income bracket – in other words, the people who make the most money – have had the value of their stocks triple in value since 1989.
A Slight Trend Reversal?
Though Fed numbers for this year won’t come out until late 2017, there is some evidence that stock ownership has started to increase again, even if it is just a tiny improvement. This recent Gallup poll shows 2014 and 2015 to have slightly higher numbers of people involved in the market, though it uses a different definition than the Federal Reserve for its figures. So as the “Trump Rally” comes to a close, the question remains. Did enough Americans benefit from the most recent rise in stock prices, or did those returns go only to one group?
on The good news is that the Federal Reserve, U.S. Treasury, and Federal Deposit Insurance Corporation are taking action to restore confidence and take the appropriate measures to help provide stability in the market. With this in mind, the above infographic from New York Life Investments looks at the factors that impact bonds, how different types of bonds have historically performed across market environments, and the current bond market volatility in a broader context.
Bond Market Returns
Bonds had a historic year in 2022, posting one of the worst returns ever recorded. As interest rates rose at the fastest pace in 40 years, it pushed bond prices lower due to their inverse relationship. In a rare year, bonds dropped 13%.
Source: FactSet, 01/02/2023.
Bond prices are only one part of a bond’s total return—the other looks at the income a bond provides. As interest rates have increased in the last year, it has driven higher bond yields in 2023.
Source: YCharts, 3/20/2023.
With this recent performance in mind, let’s look at some other key factors that impact the bond market.
Factors Impacting Bond Markets
Interest rates play a central role in bond market dynamics. This is because they affect a bond’s price. When rates are rising, existing bonds with lower rates are less valuable and prices decline. When rates are dropping, existing bonds with higher rates are more valuable and their prices rise. In March, the Federal Reserve raised rates 25 basis points to fall within the 4.75%-5.00% range, a level not seen since September 2007. Here are projections for where the federal funds rate is headed in 2023:
Federal Reserve Projection*: 5.1% Economist Projections**: 5.3%
*Based on median estimates in the March summary of quarterly economic projections.**Projections based on March 10-15 Bloomberg economist survey. Together, interest rates and the macroenvironment can have a positive or negative effect on bonds.
Positive
Here are three variables that may affect bond prices in a positive direction:
Lower Inflation: Reduces likelihood of interest rate hikes. Lower Interest Rates: When rates are falling, bond prices are typically higher. Recession: Can prompt a cut in interest rates, boosting bond prices.
Negative
On the other hand, here are variables that may negatively impact bond prices:
Higher Inflation: Can increase the likelihood of the Federal Reserve to raise interest rates. Rising Interest Rates: Interest rate hikes lead bond prices to fall. Weaker Fundamentals: When a bond’s credit risk gets worse, its price can drop. Credit risk indicates the chance of a default, the risk of a bond issuer not making interest payments within a given time period.
Bonds have been impacted by these negative factors since inflation started rising in March 2021.
Fixed Income Opportunities
Below, we show the types of bonds that have had the best performance during rising rates and recessions.
Source: Derek Horstmeyer, George Mason University 12/3/2022. As we can see, U.S. ultrashort bonds performed the best during rising rates. Mortgage bonds outperformed during recessions, averaging 11.4% returns, but with higher volatility. U.S. long-term bonds had 7.7% average returns, the best across all market conditions. In fact, they were also a close second during recessions. When rates are rising, ultrashort bonds allow investors to capture higher rates when they mature, often with lower historical volatility.
A Closer Look at Bond Market Volatility
While bond market volatility has jumped this year, current dislocations may provide investment opportunities. Bond dislocations allow investors to buy at lower prices, factoring in that the fundamental quality of the bond remains strong. With this in mind, here are two areas of the bond market that may provide opportunities for investors:
Investment-Grade Corporate Bonds: Higher credit quality makes them potentially less vulnerable to increasing interest rates. Intermediate Bonds (2-10 Years): Allow investors to lock in higher rates.
Both types of bonds focus on quality and capturing higher yields when faced with challenging market conditions.
Finding the Upside
Much of the volatility seen in the banking sector was due to banks buying bonds during the pandemic—or even earlier—at a time when interest rates were historically low. Since then, rates have climbed considerably. Should rates moderate or stop increasing, this may present better market conditions for bonds. In this way, today’s steep discount in bond markets may present an attractive opportunity for price appreciation. At the same time, investors can potentially lock in strong yields as inflation may subside in the coming years ahead. Learn more about bond investing strategies with New York Life Investments.