At this macro level, the global population is growing considerably – but at the micro level, the numbers are all over the map. It’s expected that some countries like Nigeria will see population numbers quadruple by 2100, while other places like China will see a decline by almost 40%. This raises the question: how different do the regions of the world look in 80 years, in terms of population?
Population by Region (1950-2100)
Today’s animation comes to us from geographer Simon Kuestenmacher who used this U.N. data to show how population by region is expected to change over the coming years.
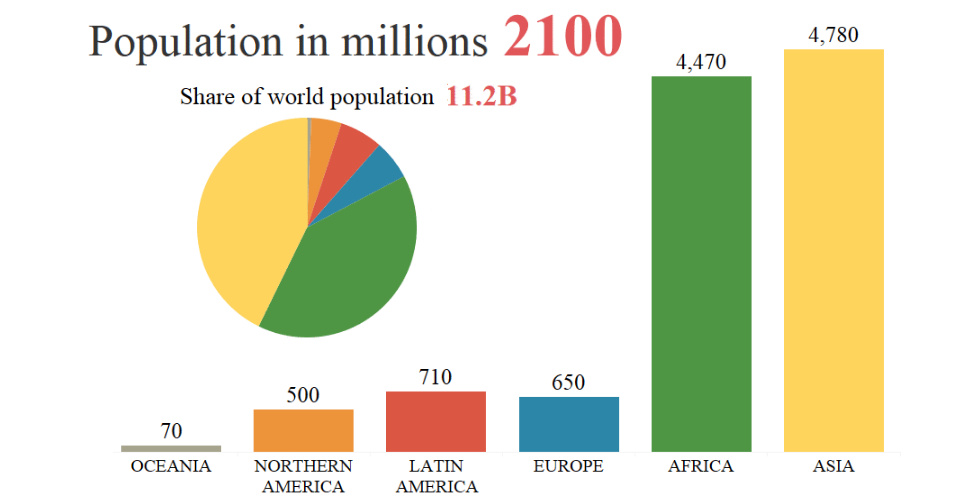
The chart shows expansive population growth in Asia until about 2060, which is when the regional population will peak at roughly 5.3 billion. At this point, the continent will make up 51% of the global population. In addition, Africa’s population is projected to continue to boom until 2100, at which point it will come close to passing Asia’s total. As we previously showed you, Africa will also be home to many of the world’s largest cities by this time.
Factors of Influence
Although 83 million people are being added to the global population every year, this population growth differs greatly by region. As a result, it’s worth looking at two major factors to see why this is the case.
The first is the fertility rate, which has obvious implications on population growth. On a global basis, this rate (measured in births per woman) is close to 2.5, and by 2100 it will have dropped to 2.0.
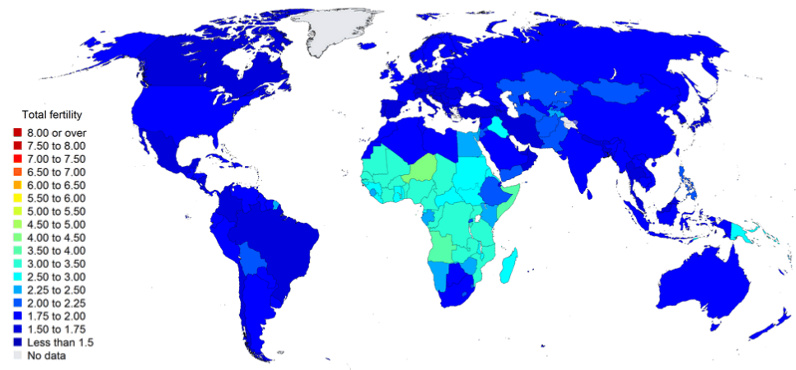
However, as you’ll see in this next chart, which shows projected fertility rates, Africa is the only region that will still have high amounts of child births 30 years from now. This will be one major driver of the continent’s population boom.
Total Fertility in 2050 (Live births per woman)
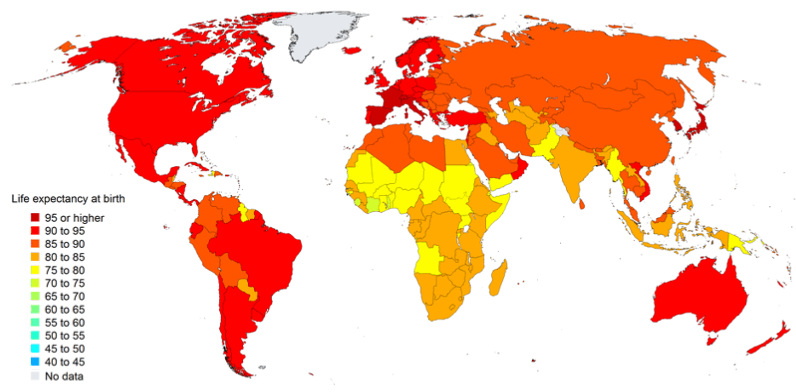
The second measure that plays a big role in these projections is life expectancy. For each new person born, how long are they expected to live? Until recently, the only countries that had a life expectancy that exceeded 80 years were in Western Europe, North America, and Oceania, with the notable exception of Japan. However, in the coming decades, even the world’s least developed countries will all be closing in on that same benchmark: Life Expectancy in 2100 (Years at birth)
The Next 30 Years
According to these same estimates, it is expected between 2017-2050 that half of all global population growth will be in just nine countries (in this order): India, Nigeria, DRC, Pakistan, Ethiopia, Tanzania, United States, Uganda, and Indonesia. Over that duration of time, it’s also projected that the populations of 26 African countries will at least double.
on The good news is that the Federal Reserve, U.S. Treasury, and Federal Deposit Insurance Corporation are taking action to restore confidence and take the appropriate measures to help provide stability in the market. With this in mind, the above infographic from New York Life Investments looks at the factors that impact bonds, how different types of bonds have historically performed across market environments, and the current bond market volatility in a broader context.
Bond Market Returns
Bonds had a historic year in 2022, posting one of the worst returns ever recorded. As interest rates rose at the fastest pace in 40 years, it pushed bond prices lower due to their inverse relationship. In a rare year, bonds dropped 13%.
Source: FactSet, 01/02/2023.
Bond prices are only one part of a bond’s total return—the other looks at the income a bond provides. As interest rates have increased in the last year, it has driven higher bond yields in 2023.
Source: YCharts, 3/20/2023.
With this recent performance in mind, let’s look at some other key factors that impact the bond market.
Factors Impacting Bond Markets
Interest rates play a central role in bond market dynamics. This is because they affect a bond’s price. When rates are rising, existing bonds with lower rates are less valuable and prices decline. When rates are dropping, existing bonds with higher rates are more valuable and their prices rise. In March, the Federal Reserve raised rates 25 basis points to fall within the 4.75%-5.00% range, a level not seen since September 2007. Here are projections for where the federal funds rate is headed in 2023:
Federal Reserve Projection*: 5.1% Economist Projections**: 5.3%
*Based on median estimates in the March summary of quarterly economic projections.**Projections based on March 10-15 Bloomberg economist survey. Together, interest rates and the macroenvironment can have a positive or negative effect on bonds.
Positive
Here are three variables that may affect bond prices in a positive direction:
Lower Inflation: Reduces likelihood of interest rate hikes. Lower Interest Rates: When rates are falling, bond prices are typically higher. Recession: Can prompt a cut in interest rates, boosting bond prices.
Negative
On the other hand, here are variables that may negatively impact bond prices:
Higher Inflation: Can increase the likelihood of the Federal Reserve to raise interest rates. Rising Interest Rates: Interest rate hikes lead bond prices to fall. Weaker Fundamentals: When a bond’s credit risk gets worse, its price can drop. Credit risk indicates the chance of a default, the risk of a bond issuer not making interest payments within a given time period.
Bonds have been impacted by these negative factors since inflation started rising in March 2021.
Fixed Income Opportunities
Below, we show the types of bonds that have had the best performance during rising rates and recessions.
Source: Derek Horstmeyer, George Mason University 12/3/2022. As we can see, U.S. ultrashort bonds performed the best during rising rates. Mortgage bonds outperformed during recessions, averaging 11.4% returns, but with higher volatility. U.S. long-term bonds had 7.7% average returns, the best across all market conditions. In fact, they were also a close second during recessions. When rates are rising, ultrashort bonds allow investors to capture higher rates when they mature, often with lower historical volatility.
A Closer Look at Bond Market Volatility
While bond market volatility has jumped this year, current dislocations may provide investment opportunities. Bond dislocations allow investors to buy at lower prices, factoring in that the fundamental quality of the bond remains strong. With this in mind, here are two areas of the bond market that may provide opportunities for investors:
Investment-Grade Corporate Bonds: Higher credit quality makes them potentially less vulnerable to increasing interest rates. Intermediate Bonds (2-10 Years): Allow investors to lock in higher rates.
Both types of bonds focus on quality and capturing higher yields when faced with challenging market conditions.
Finding the Upside
Much of the volatility seen in the banking sector was due to banks buying bonds during the pandemic—or even earlier—at a time when interest rates were historically low. Since then, rates have climbed considerably. Should rates moderate or stop increasing, this may present better market conditions for bonds. In this way, today’s steep discount in bond markets may present an attractive opportunity for price appreciation. At the same time, investors can potentially lock in strong yields as inflation may subside in the coming years ahead. Learn more about bond investing strategies with New York Life Investments.