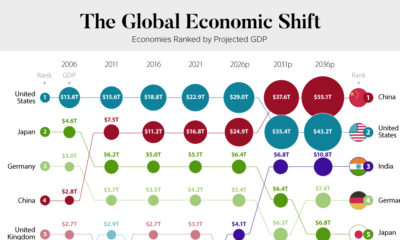
The Organization for Economic Co-operation and Development (OECD) projects that after a 4.2% drop this year, the global economy will reach pre-pandemic levels in 2021. This animation, which uses data from the OECD, shows which countries will recover the fastest from the global recession in 2020.
Economic Forecast by Country
The projections assume that renewed virus outbreaks remain contained, and that a widely available vaccine near the end of 2021 helps to support confidence. Information used in the projections, such as monetary and fiscal policies, is as of November 27, 2020. Here is how the economic forecasts break down for both OECD and non-OECD countries, sorted by projected real GDP growth in 2021: China started recovering earlier than most countries, and is projected to be the only country with positive GDP growth in 2020. Strong growth will continue in 2021, when China will account for over one-third of global economic growth. Meanwhile, India experienced one of the world’s tightest lockdowns and will see a large GDP drop in 2020. The decline has exacerbated inequality, as school closures disrupt meal programmes and prompt dropouts by disadvantaged children. While the economy is forecast to grow from 2021-2022, it may take almost two years for GDP to fully recover. Out of the countries measured in OECD’s forecast, Argentina will see the biggest GDP decline in 2021. Rising unemployment and inflationary pressures have contributed to the decline. New Zealand’s GDP loss was similar to the OECD average, despite a larger drop in mobility, from the last quarter of 2019 to the second quarter of 2020. A recovery will partially depend on travel restrictions, as tourism accounted for 20% of the country’s total employment in 2019.
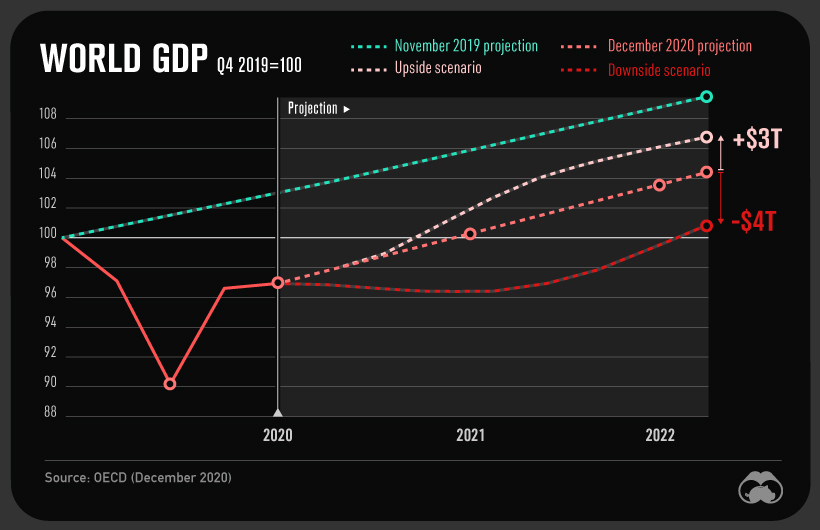
A Fragile Recovery
Considerable uncertainty about near-term GDP projections remain—$7 trillion of uncertainty, to be exact.
A downside scenario would be caused by delayed vaccinations or new outbreaks, and would lead to a $4 trillion GDP loss by 2022 compared to current projections. An upside scenario, spurred by fast vaccine rollout and boosted consumer and business confidence, could add $3 trillion to the global economy. However, it is likely that the pandemic has caused permanent losses no matter the scenario. As we wait for vaccines to be widely available, the OECD recommends that governments implement clear COVID-19 containment measures. While debt-to-GDP ratios have risen substantially due to stimulus packages, the organization also recommends that governments maintain strong fiscal support. In particular, policies should be directed towards the most vulnerable, such as low-skilled workers, small businesses, and children. This may foster a more even recovery from the global recession of 2020. on Last year, stock and bond returns tumbled after the Federal Reserve hiked interest rates at the fastest speed in 40 years. It was the first time in decades that both asset classes posted negative annual investment returns in tandem. Over four decades, this has happened 2.4% of the time across any 12-month rolling period. To look at how various stock and bond asset allocations have performed over history—and their broader correlations—the above graphic charts their best, worst, and average returns, using data from Vanguard.
How Has Asset Allocation Impacted Returns?
Based on data between 1926 and 2019, the table below looks at the spectrum of market returns of different asset allocations:
We can see that a portfolio made entirely of stocks returned 10.3% on average, the highest across all asset allocations. Of course, this came with wider return variance, hitting an annual low of -43% and a high of 54%.
A traditional 60/40 portfolio—which has lost its luster in recent years as low interest rates have led to lower bond returns—saw an average historical return of 8.8%. As interest rates have climbed in recent years, this may widen its appeal once again as bond returns may rise.
Meanwhile, a 100% bond portfolio averaged 5.3% in annual returns over the period. Bonds typically serve as a hedge against portfolio losses thanks to their typically negative historical correlation to stocks.
A Closer Look at Historical Correlations
To understand how 2022 was an outlier in terms of asset correlations we can look at the graphic below:
The last time stocks and bonds moved together in a negative direction was in 1969. At the time, inflation was accelerating and the Fed was hiking interest rates to cool rising costs. In fact, historically, when inflation surges, stocks and bonds have often moved in similar directions. Underscoring this divergence is real interest rate volatility. When real interest rates are a driving force in the market, as we have seen in the last year, it hurts both stock and bond returns. This is because higher interest rates can reduce the future cash flows of these investments. Adding another layer is the level of risk appetite among investors. When the economic outlook is uncertain and interest rate volatility is high, investors are more likely to take risk off their portfolios and demand higher returns for taking on higher risk. This can push down equity and bond prices. On the other hand, if the economic outlook is positive, investors may be willing to take on more risk, in turn potentially boosting equity prices.
Current Investment Returns in Context
Today, financial markets are seeing sharp swings as the ripple effects of higher interest rates are sinking in. For investors, historical data provides insight on long-term asset allocation trends. Over the last century, cycles of high interest rates have come and gone. Both equity and bond investment returns have been resilient for investors who stay the course.