Major fiscal policy changes can take time to be implemented — but since central banks can make moves unilaterally, monetary policy is often the first line of defense in settling markets. As the ripple effect of the COVID-19 pandemic rages on, central banks have been quick to act in slashing interest rates. However, with rates already sitting at historic lows before the crisis, it is possible that banks may be forced to employ more unconventional and controversial techniques to try and calm the economy as time goes on.
The Fed: Firing at Will
The most meaningful rate cuts happened on March 3rd and March 15th after emergency meetings in the United States. First, the Federal Open Market Committee (FOMC) cut the target rate from 1.5% to 1.0% — and then on Sunday (March 15th) the rate got chopped by an entire percentage point to rub up against the lower bound of zero.
As you can see on the chart, this puts us back into familiar territory: a policy environment analogous to that seen during the recovery from the financial crisis.
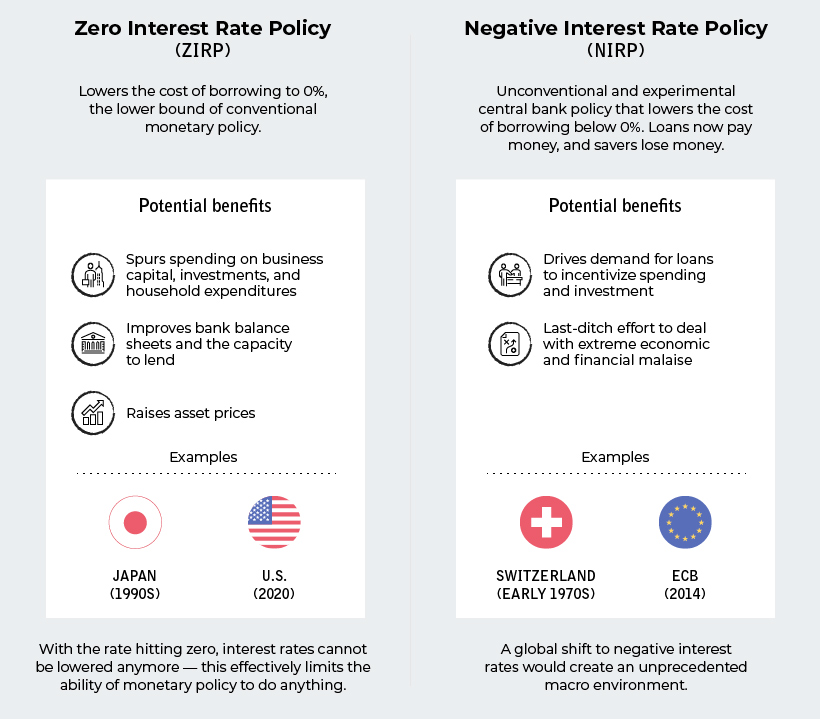
ZIRP or NIRP?
It’s been awhile, but with interest rates again bumping up against the lower bound, you’ll begin to see discussions pop up again about the effectiveness of zero interest rate policy (ZIRP) and even negative interest rate policy (NIRP). Although the latter has been used by some European banks in recent years, NIRP has never been experimented with in the United States or Canada. Here’s a quick primer on both:
With rates sitting at zero, it’s not impossible for the Fed and other central banks to begin toying more seriously with the idea of negative rates. Such a move would be bold, but also seen as highly experimental and risky with unforeseen consequences.
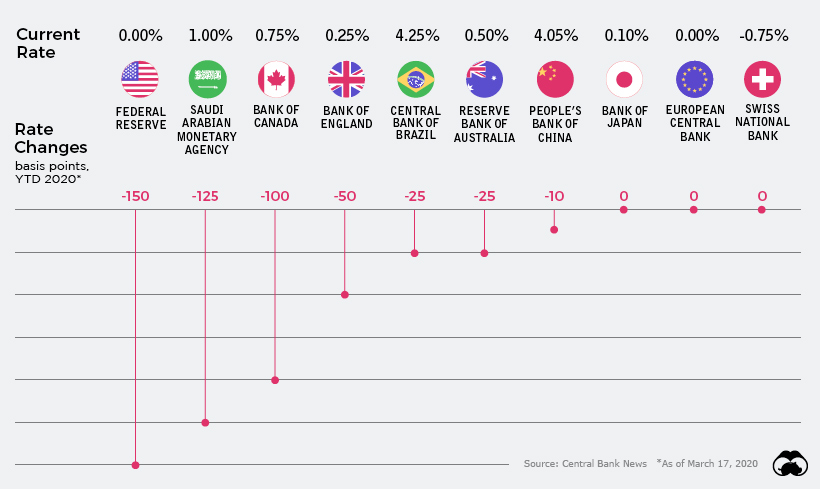
Global Rate Slashing
Since only the beginning of March, the world’s central banks have cut interest rates on 37 separate occasions. The only exception to this rule was the National Bank of Kazakhstan, which raised its key rate by 2.75% to support its currency in light of current oil prices. Even so, the Kazakhstani tenge has lost roughly 15% of its value against the U.S. dollar since February. Here’s a look at cumulative interest rate cuts by some of the world’s most important central banks, from January 1, 2020 until today:
Going into the year, rates in developed economies were already between 0% and 2%. Despite not having much room to work with, banks have slashed rates where they can — and now out of major developed economies, Canada has the “highest” interest rate at just 0.75%.
Helicopters on the Horizon
With central banks running out of ammo for the use of traditional measures, the conversation is quickly shifting to unconventional measures such as “helicopter money” and NIRP. Life is already surreal as societal measures to defend against the spread of COVID-19 unfold; pretty soon, monetary measures taken around the globe may seem just as bizarre. Put another way, unless something changes fast and miraculously, we could be moving into an unprecedented monetary environment where up is down, and down is up. At that point, it’s anybody’s guess as to how things will shake out going forward. on Last year, stock and bond returns tumbled after the Federal Reserve hiked interest rates at the fastest speed in 40 years. It was the first time in decades that both asset classes posted negative annual investment returns in tandem. Over four decades, this has happened 2.4% of the time across any 12-month rolling period. To look at how various stock and bond asset allocations have performed over history—and their broader correlations—the above graphic charts their best, worst, and average returns, using data from Vanguard.
How Has Asset Allocation Impacted Returns?
Based on data between 1926 and 2019, the table below looks at the spectrum of market returns of different asset allocations:
We can see that a portfolio made entirely of stocks returned 10.3% on average, the highest across all asset allocations. Of course, this came with wider return variance, hitting an annual low of -43% and a high of 54%.
A traditional 60/40 portfolio—which has lost its luster in recent years as low interest rates have led to lower bond returns—saw an average historical return of 8.8%. As interest rates have climbed in recent years, this may widen its appeal once again as bond returns may rise.
Meanwhile, a 100% bond portfolio averaged 5.3% in annual returns over the period. Bonds typically serve as a hedge against portfolio losses thanks to their typically negative historical correlation to stocks.
A Closer Look at Historical Correlations
To understand how 2022 was an outlier in terms of asset correlations we can look at the graphic below:
The last time stocks and bonds moved together in a negative direction was in 1969. At the time, inflation was accelerating and the Fed was hiking interest rates to cool rising costs. In fact, historically, when inflation surges, stocks and bonds have often moved in similar directions. Underscoring this divergence is real interest rate volatility. When real interest rates are a driving force in the market, as we have seen in the last year, it hurts both stock and bond returns. This is because higher interest rates can reduce the future cash flows of these investments. Adding another layer is the level of risk appetite among investors. When the economic outlook is uncertain and interest rate volatility is high, investors are more likely to take risk off their portfolios and demand higher returns for taking on higher risk. This can push down equity and bond prices. On the other hand, if the economic outlook is positive, investors may be willing to take on more risk, in turn potentially boosting equity prices.
Current Investment Returns in Context
Today, financial markets are seeing sharp swings as the ripple effects of higher interest rates are sinking in. For investors, historical data provides insight on long-term asset allocation trends. Over the last century, cycles of high interest rates have come and gone. Both equity and bond investment returns have been resilient for investors who stay the course.