The world is not a perfect place, and there are many injustices that still must be combatted. Just some of these include racism, sexism, income inequality, climate change, terrorism, soaring debt, corruption, and food and water security. Many groups of people have it rough, and they deservedly have an axe to grind. There’s plenty of work to still be done. However, sometimes we get so caught up in our day-to-day battles and the negative news stories that we forget to look at the big picture – and the big picture actually provides a lot of optimism. Despite the majority of Americans being pessimistic about the future, the world is actually getting better as a whole: people are living longer and healthier lives, crime and violence are down, and living standards are generally improving.
Could an End to World Poverty be near?
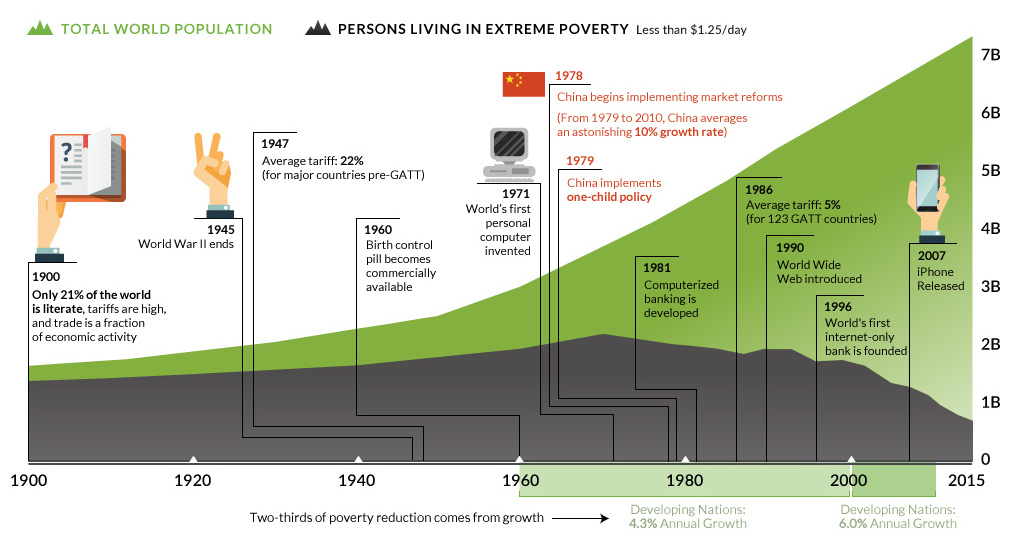
One particular area that is fascinating to look at is poverty. In absolute terms, the total amount of people living in extreme poverty peaked in 1970 when 2.2 billion of the world’s 3.7 billion people lived on less than $1.25 per day. Today, in an astonishing reversal, only 0.7 billion of 7.3 billion people are below this poverty-line worldwide. While progress has been made in many countries, the story of China is of particular interest: after market reforms started being introduced in 1978, the country grew at an average pace of 10% per year until 2010. Over this period of time, at least 800 million people were lifted out of absolute poverty. And while there is still much work to be done, this is an undeniable step in the right direction. The U.N. even has a bold target to end extreme world poverty by 2030. Based on the progress so far, this doesn’t seem unrealistic.
Contributing Factors
Why have we made so much progress in this realm? One of the most important factors is very simple: it’s estimated that two-thirds of poverty reduction comes from good old-fashioned economic growth. For every 1% increase in GDP per head, poverty is reduced by 1.7%. From 1960 to 2000, developing nations grew at an average pace of 4.3% – and from 2000 to 2010, they grew at an even faster pace of 6.0% per year. This helped lift a lot of people out of extreme poverty. The other factor for the remaining one-third? It’s income distribution. The degree to which economic growth helps the poorest depends on their chances of getting some of that benefit. It’s estimated that a 1% increase in GDP per head in the least equal countries only reduces poverty by 0.6%, while it does so by 4.3% in the most equal of places. More growth and more equality will make it possible for this powerful trend in poverty reduction to continue. And by 2030 – who knows – maybe extreme levels of poverty will be an afterthought for society. on These are in the form of Treasury securities, some of the most liquid assets worldwide. Central banks use them for foreign exchange reserves and private investors flock to them during flights to safety thanks to their perceived low default risk. Beyond these reasons, foreign investors may buy Treasuries as a store of value. They are often used as collateral during certain international trade transactions, or countries can use them to help manage exchange rate policy. For example, countries may buy Treasuries to protect their currency’s exchange rate from speculation. In the above graphic, we show the foreign holders of the U.S. national debt using data from the U.S. Department of the Treasury.
Top Foreign Holders of U.S. Debt
With $1.1 trillion in Treasury holdings, Japan is the largest foreign holder of U.S. debt. Japan surpassed China as the top holder in 2019 as China shed over $250 billion, or 30% of its holdings in four years. This bond offloading by China is the one way the country can manage the yuan’s exchange rate. This is because if it sells dollars, it can buy the yuan when the currency falls. At the same time, China doesn’t solely use the dollar to manage its currency—it now uses a basket of currencies. Here are the countries that hold the most U.S. debt: As the above table shows, the United Kingdom is the third highest holder, at over $655 billion in Treasuries. Across Europe, 13 countries are notable holders of these securities, the highest in any region, followed by Asia-Pacific at 11 different holders. A handful of small nations own a surprising amount of U.S. debt. With a population of 70,000, the Cayman Islands own a towering amount of Treasury bonds to the tune of $284 billion. There are more hedge funds domiciled in the Cayman Islands per capita than any other nation worldwide. In fact, the four smallest nations in the visualization above—Cayman Islands, Bermuda, Bahamas, and Luxembourg—have a combined population of just 1.2 million people, but own a staggering $741 billion in Treasuries.
Interest Rates and Treasury Market Dynamics
Over 2022, foreign demand for Treasuries sank 6% as higher interest rates and a strong U.S. dollar made owning these bonds less profitable. This is because rising interest rates on U.S. debt makes the present value of their future income payments lower. Meanwhile, their prices also fall. As the chart below shows, this drop in demand is a sharp reversal from 2018-2020, when demand jumped as interest rates hovered at historic lows. A similar trend took place in the decade after the 2008-09 financial crisis when U.S. debt holdings effectively tripled from $2 to $6 trillion.
Driving this trend was China’s rapid purchase of Treasuries, which ballooned from $100 billion in 2002 to a peak of $1.3 trillion in 2013. As the country’s exports and output expanded, it sold yuan and bought dollars to help alleviate exchange rate pressure on its currency. Fast-forward to today, and global interest-rate uncertainty—which in turn can impact national currency valuations and therefore demand for Treasuries—continues to be a factor impacting the future direction of foreign U.S. debt holdings.