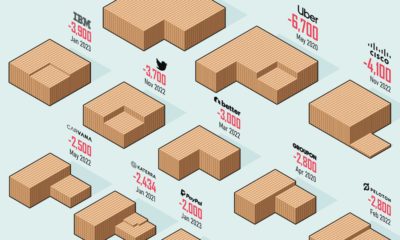
It’s a fair question, and it’s certainly one that is a hot topic of debate among experts trying to figure out the ultimate impact of AI and automation on the global economy. While no one knows the outcome for sure, what is clear is how the job distribution has changed over time: as jobs in agriculture and manufacturing have disappeared, new jobs have materialized in other sectors.
U.S. Employment by Sector
Today’s chart uses data from the McKinsey Global Institute that shows U.S. employment by sector between the years of 1850 and 2015. Here is a recap of the data, by sector: The agricultural sector was king in 1850, providing a whopping 60% of all U.S. employment. Much later on, in the mid-20th century, factories took the country by storm. By the year 1960, the high-flying manufacturing sector eventually peaked at a share of 26% of all American jobs. Of course, for any prospective job seeker in the modern era, it’s rare to see jobs advertised in either of these sectors. That’s because today, they add up to fewer than 13% of the total jobs that exist in the country, and it’s likely these shares will continue to decline as time passes.
An Ever-Changing Landscape
While the eventual impact of AI and automation on the U.S. job picture remains unclear, this above data series does provide some comfort – after all, history doesn’t always repeat, but it often rhymes. In the timeframe of 1850 to 2015, it’s clear that new technologies came in and disrupted the prevailing industries. Many jobs were lost in key sectors like manufacturing and farming, but they’ve been replaced (so far) with new jobs in other sectors. With the effects of automation expected to be felt in OECD countries by the mid-2020s, it’s likely we won’t have to wait long to see how things shake out this time around. on Today’s chart measures the extent to which 41 major economies are reopening, by plotting two metrics for each country: the mobility rate and the COVID-19 recovery rate: Data for the first measure comes from Google’s COVID-19 Community Mobility Reports, which relies on aggregated, anonymous location history data from individuals. Note that China does not show up in the graphic as the government bans Google services. COVID-19 recovery rates rely on values from CoronaTracker, using aggregated information from multiple global and governmental databases such as WHO and CDC.
Reopening Economies, One Step at a Time
In general, the higher the mobility rate, the more economic activity this signifies. In most cases, mobility rate also correlates with a higher rate of recovered people in the population. Here’s how these countries fare based on the above metrics. Mobility data as of May 21, 2020 (Latest available). COVID-19 case data as of May 29, 2020. In the main scatterplot visualization, we’ve taken things a step further, assigning these countries into four distinct quadrants:
1. High Mobility, High Recovery
High recovery rates are resulting in lifted restrictions for countries in this quadrant, and people are steadily returning to work. New Zealand has earned praise for its early and effective pandemic response, allowing it to curtail the total number of cases. This has resulted in a 98% recovery rate, the highest of all countries. After almost 50 days of lockdown, the government is recommending a flexible four-day work week to boost the economy back up.
2. High Mobility, Low Recovery
Despite low COVID-19 related recoveries, mobility rates of countries in this quadrant remain higher than average. Some countries have loosened lockdown measures, while others did not have strict measures in place to begin with. Brazil is an interesting case study to consider here. After deferring lockdown decisions to state and local levels, the country is now averaging the highest number of daily cases out of any country. On May 28th, for example, the country had 24,151 new cases and 1,067 new deaths.
3. Low Mobility, High Recovery
Countries in this quadrant are playing it safe, and holding off on reopening their economies until the population has fully recovered. Italy, the once-epicenter for the crisis in Europe is understandably wary of cases rising back up to critical levels. As a result, it has opted to keep its activity to a minimum to try and boost the 65% recovery rate, even as it slowly emerges from over 10 weeks of lockdown.
4. Low Mobility, Low Recovery
Last but not least, people in these countries are cautiously remaining indoors as their governments continue to work on crisis response. With a low 0.05% recovery rate, the United Kingdom has no immediate plans to reopen. A two-week lag time in reporting discharged patients from NHS services may also be contributing to this low number. Although new cases are leveling off, the country has the highest coronavirus-caused death toll across Europe. The U.S. also sits in this quadrant with over 1.7 million cases and counting. Recently, some states have opted to ease restrictions on social and business activity, which could potentially result in case numbers climbing back up. Over in Sweden, a controversial herd immunity strategy meant that the country continued business as usual amid the rest of Europe’s heightened regulations. Sweden’s COVID-19 recovery rate sits at only 13.9%, and the country’s -93% mobility rate implies that people have been taking their own precautions.
COVID-19’s Impact on the Future
It’s important to note that a “second wave” of new cases could upend plans to reopen economies. As countries reckon with these competing risks of health and economic activity, there is no clear answer around the right path to take. COVID-19 is a catalyst for an entirely different future, but interestingly, it’s one that has been in the works for a while. —Carmen Reinhart, incoming Chief Economist for the World Bank Will there be any chance of returning to “normal” as we know it?