Currently, many sovereign rates sit in negative territory, and there is an unprecedented $10 trillion in negative-yielding debt. This new interest rate climate has many observers wondering where the bottom truly lies. Today’s graphic from Paul Schmelzing, visiting scholar at the Bank of England (BOE), shows how global real interest rates have experienced an average annual decline of -0.0196% (-1.96 basis points) throughout the past eight centuries.
The Evidence on Falling Rates
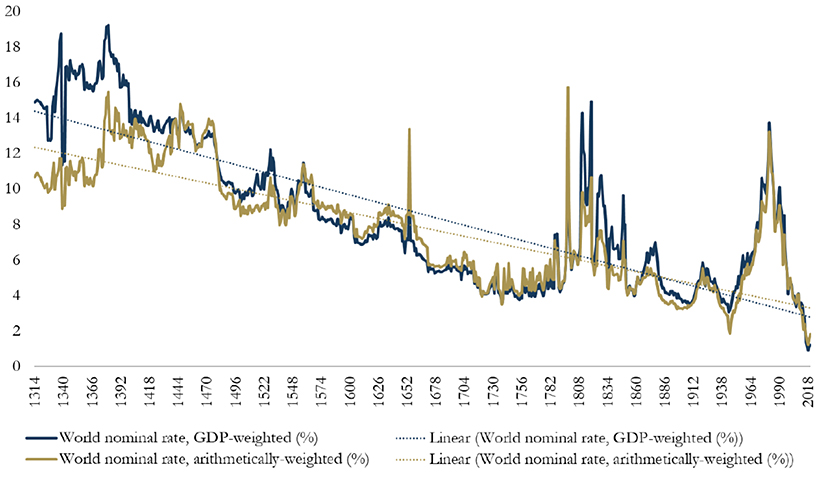
Collecting data from across 78% of total advanced economy GDP over the time frame, Schmelzing shows that real rates* have witnessed a negative historical slope spanning back to the 1300s. Displayed across the graph is a series of personal nominal loans made to sovereign establishments, along with their nominal loan rates. Some from the 14th century, for example, had nominal rates of 35%. By contrast, key nominal loan rates had fallen to 6% by the mid 1800s. Centennial Averages of Real Long-Term “Safe-Asset”† Rates From 1311-2018 *Real rates take inflation into account, and are calculated as follows: nominal rate – inflation = real rate. †Safe assets are issued from global financial powers Starting in 1311, data from the report shows how average real rates moved from 5.1% in the 1300s down to an average of 2% in the 1900s. The average real rate between 2000-2018 stands at 1.3%.
Current Theories
Why have interest rates been trending downward for so long? Here are the three prevailing theories as to why they’re dropping:
1. Productivity Growth
Since 1970, productivity growth has slowed. A nation’s productive capacity is determined by a number of factors, including labor force participation and economic output. If total economic output shrinks, real rates will decline too, theory suggests. Lower productivity growth leads to lower wage growth expectations. In addition, lower productivity growth means less business investment, therefore a lower demand for capital. This in turn causes the lower interest rates.
2. Demographics
Demographics impact interest rates on a number of levels. The aging population—paired with declining fertility levels—result in higher savings rates, longer life expectancies, and lower labor force participation rates. In the U.S., baby boomers are retiring at a pace of 10,000 people per day, and other advanced economies are also seeing comparable growth in retirees. Theory suggests that this creates downward pressure on real interest rates, as the number of people in the workforce declines.
3. Economic Growth
Dampened economic growth can also have a negative impact on future earnings, pushing down the real interest rate in the process. Since 1961, GDP growth among OECD countries has dropped from 4.3% to 3% in 2018. Larry Summers referred to this sloping trend since the 1970s as “secular stagnation” during an International Monetary Fund conference in 2013. Secular stagnation occurs when the economy is faced with persistently lagging economic health. One possible way to address a declining interest rate conundrum, Summers has suggested, is through expansionary government spending.
Bond Yields Declining
According to the report, another trend has coincided with falling interest rates: declining bond yields. Since the 1300s, global nominal bonds yields have dropped from over 14% to around 2%.
The graph illustrates how real interest rates and bond yields appear to slope across a similar trend line. While it may seem remarkable that interest rates keep falling, this phenomenon shows that a broader trend may be occurring—across centuries, asset classes, and fiscal regimes. -Paul Schmelzing Although this may be fortunate for debt-seekers, it can create challenges for fixed income investors—who may seek alternatives strategies with higher yield potential instead. on Last year, stock and bond returns tumbled after the Federal Reserve hiked interest rates at the fastest speed in 40 years. It was the first time in decades that both asset classes posted negative annual investment returns in tandem. Over four decades, this has happened 2.4% of the time across any 12-month rolling period. To look at how various stock and bond asset allocations have performed over history—and their broader correlations—the above graphic charts their best, worst, and average returns, using data from Vanguard.
How Has Asset Allocation Impacted Returns?
Based on data between 1926 and 2019, the table below looks at the spectrum of market returns of different asset allocations:
We can see that a portfolio made entirely of stocks returned 10.3% on average, the highest across all asset allocations. Of course, this came with wider return variance, hitting an annual low of -43% and a high of 54%.
A traditional 60/40 portfolio—which has lost its luster in recent years as low interest rates have led to lower bond returns—saw an average historical return of 8.8%. As interest rates have climbed in recent years, this may widen its appeal once again as bond returns may rise.
Meanwhile, a 100% bond portfolio averaged 5.3% in annual returns over the period. Bonds typically serve as a hedge against portfolio losses thanks to their typically negative historical correlation to stocks.
A Closer Look at Historical Correlations
To understand how 2022 was an outlier in terms of asset correlations we can look at the graphic below:
The last time stocks and bonds moved together in a negative direction was in 1969. At the time, inflation was accelerating and the Fed was hiking interest rates to cool rising costs. In fact, historically, when inflation surges, stocks and bonds have often moved in similar directions. Underscoring this divergence is real interest rate volatility. When real interest rates are a driving force in the market, as we have seen in the last year, it hurts both stock and bond returns. This is because higher interest rates can reduce the future cash flows of these investments. Adding another layer is the level of risk appetite among investors. When the economic outlook is uncertain and interest rate volatility is high, investors are more likely to take risk off their portfolios and demand higher returns for taking on higher risk. This can push down equity and bond prices. On the other hand, if the economic outlook is positive, investors may be willing to take on more risk, in turn potentially boosting equity prices.
Current Investment Returns in Context
Today, financial markets are seeing sharp swings as the ripple effects of higher interest rates are sinking in. For investors, historical data provides insight on long-term asset allocation trends. Over the last century, cycles of high interest rates have come and gone. Both equity and bond investment returns have been resilient for investors who stay the course.