Based on how much cocoa comes from West Africa, it’s likely that most of the chocolates we eat have a little bit of Cote d’Ivoire and Ghana in them. The $130B chocolate industry relies on cocoa farming for supply of chocolate’s key ingredient. Yet, many cocoa farmers make less than $1/day. The above graphic maps the major trade flows of cocoa and allows us to dive deeper into its global supply chain.
From Bean to Bar: Stages in the Cocoa Supply Chain
Cocoa beans go through a number of stages before being used in chocolate products. Cocoa farming and trade are at the roots of the chocolate industry, and the consistent supply of cocoa plays a critical role in providing us with reasonably-priced chocolate. So where exactly does all this cocoa come from?
The Key Nations in Cocoa’s Global Supply Chain
Growing cocoa has specific temperature, water, and humidity requirements. As a result, the equatorial regions of Africa, Central and South America, and Asia are optimal for cocoa farming. These regions host the biggest cocoa exporters by value. Côte d’Ivoire and Ghana are responsible for 70% of global cocoa production, and cocoa exports play a huge role in their economies. Although the majority of exporters come from equatorial regions, Belgium stands out in fifth place. On the other hand, most of the top importers are in Europe—the Netherlands and Germany being the top two. In third place, the U.S. primarily sources its cocoa from Côte d’Ivoire, Ghana, and Ecuador. Mars, Hershey, Cargill, and Blommer—some of the world’s biggest chocolate manufacturers and processors—are headquartered in the U.S. Finally, it comes as no surprise that the biggest importers of cocoa beans are among the biggest chocolate exporters. Not only is the Netherlands the biggest importer of beans, but it’s also the biggest processor—grinding 600,000 tons annually—and the fourth largest exporter of chocolate products. Belgium is another key nation in the supply chain, importing cocoa beans from producing countries and exporting them across Europe. It’s also home to the world’s largest chocolate factory, supporting its annual chocolate exports worth $3.1 billion.
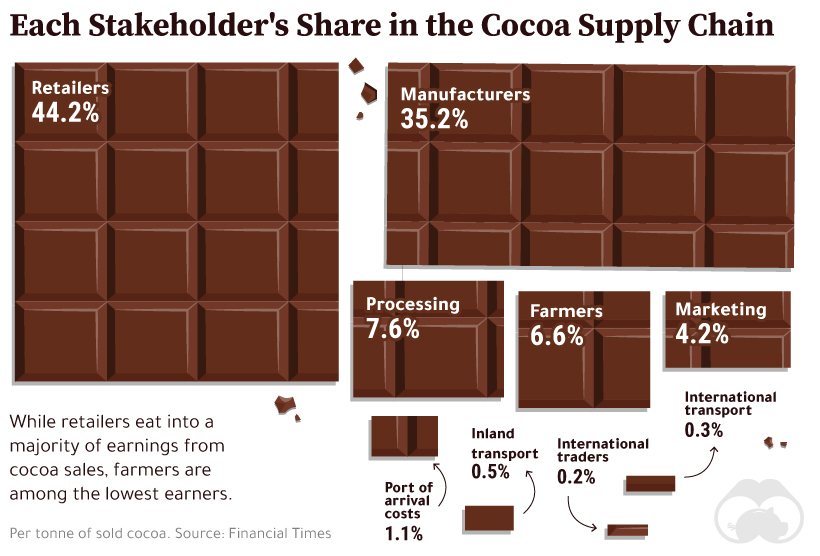
Breaking Down the Cocoa Supply Chain: Who Gets What
Without farmers, both the cocoa and chocolate industries are likely to suffer from shortages, with domino effects on higher overall costs. Yet, they have little ability to influence prices at present.
Farmers are among the lowest earners from a tonne of sold cocoa—accounting for just 6.6% of the value of the final sale. Low incomes also translate into numerous other issues associated with cocoa farming.
The Bitter Side of Cocoa Farming
The World Bank has established the threshold for extreme poverty at $1.90/day. Cocoa farmers in Ghana make $1/day, while those in Côte d’Ivoire make around $0.78/day—both significantly below the extreme poverty line. Farmers are often unable to bear the costs of cocoa farming as a result of low incomes. In turn, they employ children, who miss out on education, are exposed to hazardous working conditions, and get paid little or no wages. To make matters worse, cocoa farming is primarily responsible for deforestation and illegal farming in Côte d’Ivoire and Ghana—adding environmental issues to the mix. These interconnected problems call for action, so what is being done to fight them?
Combating Cocoa’s Concerns
Mars, Nestlé, and Hershey—some of the world’s biggest chocolate manufacturers—have made several pledges to eradicate child labor in cocoa farming over the last two decades, but haven’t reached their targets. In addition, organizations such as UTZ Certified, Rainforest Alliance, and Fairtrade are working to increase traceability in the supply chain by selling ‘certified cocoa’, sourced from farms that prohibit child labor. More recently, Côte d’Ivoire and Ghana announced a fixed premium of US$400/tonne on cocoa futures, aiming to improve farmer livelihoods by creating a union for cocoa, also known colloquially as the “COPEC” for the industry. While these initiatives have had some positive impacts, more still needs to be done to successfully eradicate large-scale child labor and poverty of those involved in cocoa’s bittersweet supply chain. on Last year, stock and bond returns tumbled after the Federal Reserve hiked interest rates at the fastest speed in 40 years. It was the first time in decades that both asset classes posted negative annual investment returns in tandem. Over four decades, this has happened 2.4% of the time across any 12-month rolling period. To look at how various stock and bond asset allocations have performed over history—and their broader correlations—the above graphic charts their best, worst, and average returns, using data from Vanguard.
How Has Asset Allocation Impacted Returns?
Based on data between 1926 and 2019, the table below looks at the spectrum of market returns of different asset allocations:
We can see that a portfolio made entirely of stocks returned 10.3% on average, the highest across all asset allocations. Of course, this came with wider return variance, hitting an annual low of -43% and a high of 54%.
A traditional 60/40 portfolio—which has lost its luster in recent years as low interest rates have led to lower bond returns—saw an average historical return of 8.8%. As interest rates have climbed in recent years, this may widen its appeal once again as bond returns may rise.
Meanwhile, a 100% bond portfolio averaged 5.3% in annual returns over the period. Bonds typically serve as a hedge against portfolio losses thanks to their typically negative historical correlation to stocks.
A Closer Look at Historical Correlations
To understand how 2022 was an outlier in terms of asset correlations we can look at the graphic below:
The last time stocks and bonds moved together in a negative direction was in 1969. At the time, inflation was accelerating and the Fed was hiking interest rates to cool rising costs. In fact, historically, when inflation surges, stocks and bonds have often moved in similar directions. Underscoring this divergence is real interest rate volatility. When real interest rates are a driving force in the market, as we have seen in the last year, it hurts both stock and bond returns. This is because higher interest rates can reduce the future cash flows of these investments. Adding another layer is the level of risk appetite among investors. When the economic outlook is uncertain and interest rate volatility is high, investors are more likely to take risk off their portfolios and demand higher returns for taking on higher risk. This can push down equity and bond prices. On the other hand, if the economic outlook is positive, investors may be willing to take on more risk, in turn potentially boosting equity prices.
Current Investment Returns in Context
Today, financial markets are seeing sharp swings as the ripple effects of higher interest rates are sinking in. For investors, historical data provides insight on long-term asset allocation trends. Over the last century, cycles of high interest rates have come and gone. Both equity and bond investment returns have been resilient for investors who stay the course.