But this too is just myth. In fact, as a financial asset, gold’s value has shone over time with periods of exceptional performance, one of which may be occurring now. Today’s infographic comes to us from Sprott Physical Gold Trust and outlines the history of the price of gold from 1915 to 2020 and three bull markets or “Golden bulls” since 1969, using monthly data from the London Bullion Market Association. But first a little history…
The Gold Standard
*All figures are in USD
During the early days of the American Republic, the U.S. used the British gold standard to set the price of its currency. In 1791, it established the price of gold at $19.75 per ounce but also allowed redemption in silver. In 1834, it raised the price of gold to $20.67 per ounce. The price of gold would retain a nominal value through depressions, civil wars, and wars.
However, $20 today is not the same as $20 in the past. The U.S. dollar may have been convertible at a set price, but the amount of goods that it could buy varies year to year based on inflation. So for example from 1934 to 1938, one ounce of gold would cost $34, but $34 today would purchase a small fraction of an ounce of gold.
While the price of gold may appear cheap in the past, adjusted for inflation it is not as low as you would think. Governments would set the price of its currency against an asset to ensure the stability of prices, however if there would be too many claims against the underlying asset, that asset would run out and the currency would become worthless.
This threat would force the hands of governments to change the standards, as currency became more common and gold reserves more scarce.
An Era of Government Intervention
In the wake of the 1929 stock market crash, investors started redeeming U.S. dollars for its equivalent value in gold, removing currency from the economy. In order to stem the flow of funds into gold and the depletion of government gold reserves, in 1933, President Franklin D. Roosevelt limited the private ownership of gold to discourage hoarding and encourage investing. In 1934, Congress passed the Gold Reserve Act which prohibited the private ownership of gold and nominally raised the price of gold to $35 per ounce. In 1944, the victorious Allied powers negotiated the Bretton Woods Agreement, making the U.S. dollar the official global reserve currency. The United States ensured an ounce of gold would be worth $35 in its currency—at least until the onset of a stagnant economy in the early Seventies led to the official end of any real gold standard.
Golden Bull #1: December 1969 – January 1980
In 1969, the U.S. gold standard had risen to $42 per ounce in nominal terms, however a period of economic volatility would challenge and change U.S. monetary policy. On August 15, 1971, President Richard Nixon mandated the Federal Reserve to stop honoring the U.S. dollar’s value in gold at a fixed value, abandoning the gold standard. In 1974, President Gerald Ford would once again allow the private ownership of gold bullion. Energy crises, soaring inflation, and high unemployment stagnated the economy. By January 1980, the price of gold reached $2,234 per ounce in today’s dollars amidst an environment of double-digit inflation. Federal Reserve chairman Paul Volcker fought this inflation with double-digit interest rates which in turn slowed the economy, causing a recession. The interest-rate-induced recession would herald in a new global economic boom that defined the Eighties and Nineties. The price of gold dropped to $753.96 per ounce by June 1985, as the economy improved. From December 1969 to January 1980, gold rose from $285 to $2,234 per ounce, an increase of 684% over 122 months, in inflation-adjusted terms.
Golden Bull #2: August 1999 – August 2011
Expanding household incomes and ever declining interest rates under Federal Reserve chairman Greenspan pushed gold further down to a low of $377.44 per ounce by the end of April 2001.
Loose monetary policy and a reduced tax on capital gains spurred speculative investments into the new internet economy through a growing retail brokerage market and the emergence of venture capital. The tech bubble would eventually pop as these companies were unable to build sustainable businesses and investor money dried up.
Over the year of 2000, investors rushed to exit their speculative tech investments resulting in several market crashes. Then in September 2001, 9/11 happened, marking the beginning of a new era. Gold steadily rose during this period.
In 2008, the Global Financial Crisis shook financial markets and left a recession. Policy makers and central bankers embarked on a controversial policy of quantitative easing to support financial markets. The price of one ounce of gold reached new highs by the end of August 2011, as worries on debt levels mounted for the U.S. and other countries.
From August 1999 to August 2011, gold rose from $394 to $2,066 per ounce, an increase of 425% over 145 months, in inflation-adjusted terms.
Golden Bull #3?: November 2015 – May 2020
In the aftermath of the GFC, the Federal Reserve stoked an economic recovery with cheap money, seeing gold track to a low of $1,050 per ounce by December 2015. It was not until the election of a peculiar American president in 2016 that gold would rise again. Pressure to increase interest rates, an aging debt-fueled economic recovery, a trade war with China, and the recent COVID-19 crisis has once again provoked economic uncertainty and a renewed interest in gold. With interest rates already at historic lows and quantitative easing as standard operating procedure, global economies are entering unprecedented territory. There is still little insight into the direction of the economy but since November 2015 to May 2020, the price of gold has risen from $1,146 to $1,726 per ounce, 55% over 55 months.
Gold Going Forward
In an era of tech startups, ETFs, and algorithmic trading, many people consider gold to be a shiny paperweight—however, its performance over time against other assets shows it is far from this. In 1915, an ounce of gold was worth $488.66 per ounce in today’s dollars and as of May 15, 2020, $1,751 per ounce. Gold has proven its value over time as companies, countries, and governments come and go. “Golden Bulls” are no periods for idle idol worship. Gold will always be gold, in myth and in fact. on A lagging stock market dented these fortunes against high interest rates, energy shocks, and economic uncertainty. But some of the world’s billionaires have flourished in this environment, posting sky-high revenues in spite of inflationary pressures. With data from Forbes Real-Time Billionaires List, we feature a snapshot of the richest people in the world in 2023.
Luxury Mogul Takes Top Spot
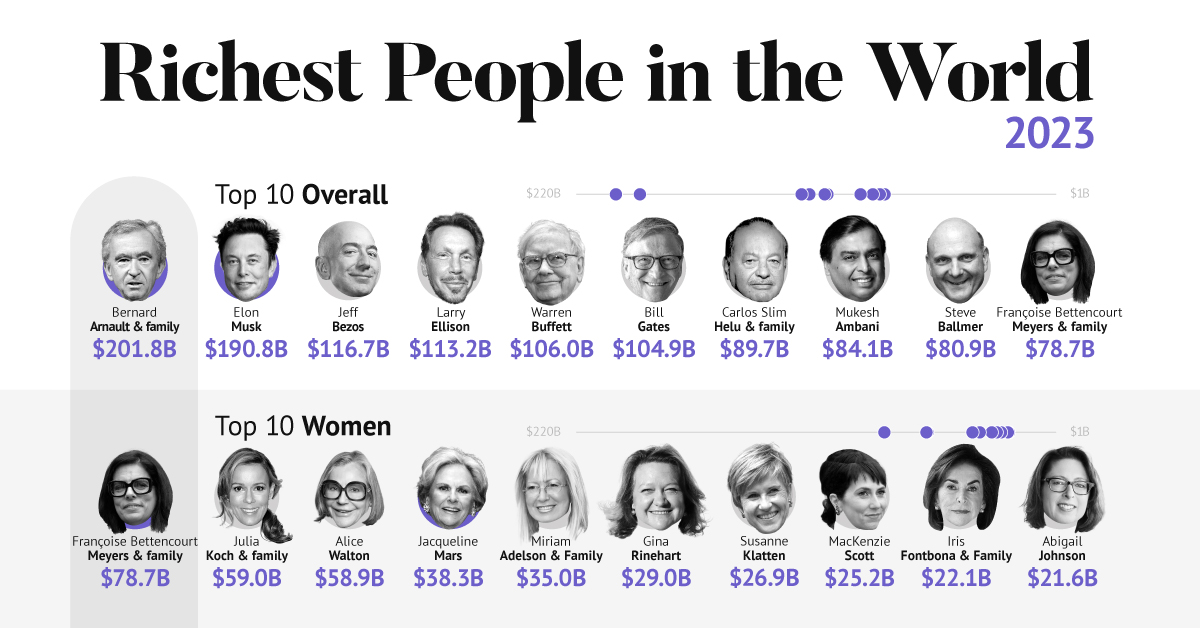
The world’s richest person is France’s Bernard Arnault, the chief executive of LVMH.
With 75 brands, the luxury conglomerate owns Louis Vuitton, Christian Dior, and Tiffany. LVMH traces back to 1985, when Arnault cut his first major deal with the company by acquiring Christian Dior, a firm that was struggling with bankruptcy.
Fast-forward to today, and the company is seeing record profits despite challenging market conditions. Louis Vuitton, for instance, has doubled its sales in four years.
In the table below, we show the world’s 10 richest people with data as of February 27, 2023:
Elon Musk, the second-wealthiest person in the world has a net worth of $191 billion. In October, Musk took over Twitter in a $44 billion dollar deal, which has drawn criticism from investors. Many say it’s a distraction from Musk’s work with Tesla.
While Tesla shares have rebounded—after falling roughly 70% in 2022—Musk’s wealth still sits about 13% lower than in March of last year.
Third on the list is Jeff Bezos, followed by Larry Ellison. The latter of the two, who founded Oracle, owns 98% of the Hawaiian island of Lanai which he bought in 2012 for $300 million.
Fifth on the list is Warren Buffett. In his annual letter to shareholders, he discussed how Berkshire Hathaway reported record operating profits despite economic headwinds. The company outperformed the S&P 500 Index by about 22% in 2022.
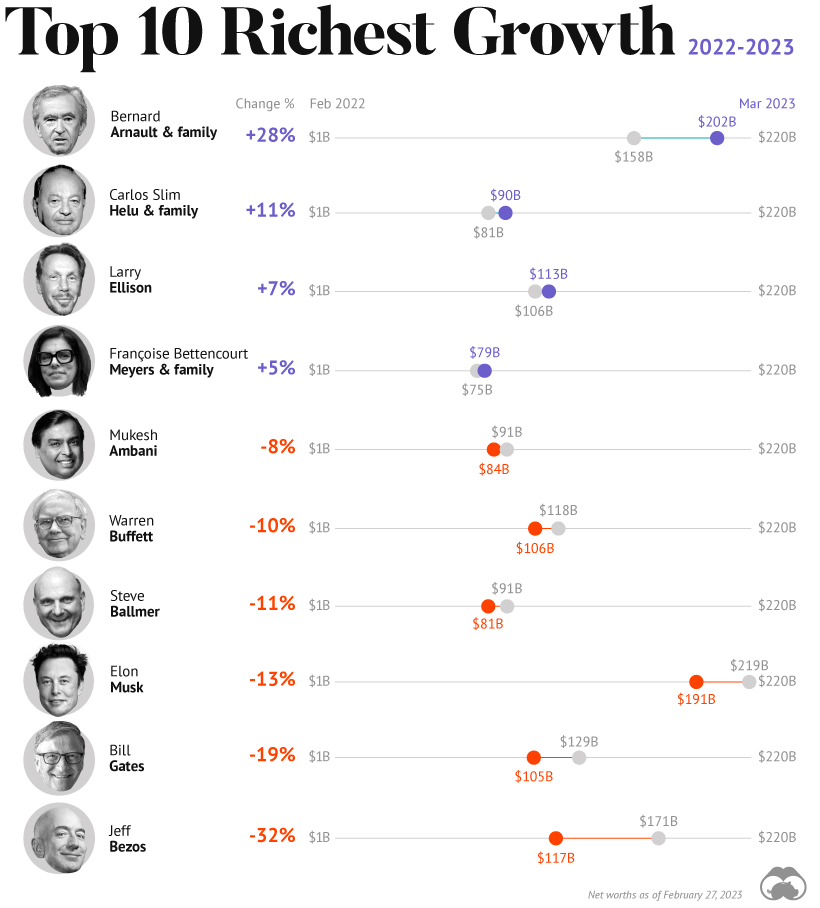
How Fortunes Have Changed
Given multiple economic crosscurrents, billionaire wealth has diverged over the last year. Since March 2022, just four of the top 10 richest in the world have seen their wealth increase. Two of these are European magnates, while Carlos Slim Helu runs the largest telecom firm in Latin America. In fact, a decade ago Slim was the richest person on the planet. Overall, as the tech sector saw dismal returns over the year, the top 10 tech billionaires lost almost $500 billion in combined wealth.
Recent Shakeups in Asia
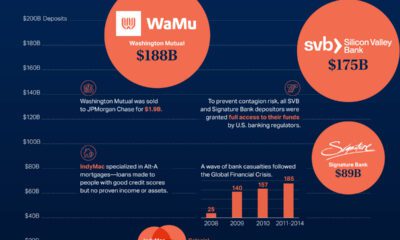
Perhaps the most striking news for the world’s richest centers around Gautam Adani, formerly the richest person in Asia. In January, Hindenburg Research, a short-selling firm, released a report claiming that the Adani Group engaged in stock manipulation and fraud. Specifically, the alleged the firm used offshore accounts to launder money, artificially boost share prices, and hide losses. The Adani Group, which owns India’s largest ports—along with ports in Australia, Sri Lanka, and Israel—lost $100 billion in value in the span of a few weeks. Interestingly, very few Indian mutual funds hold significant shares in Adani Group, signaling a lack of confidence across India’s market, which was also cited in Hindenburg’s report. As a result, Mukesh Ambani has climbed to Asia’s top spot, controlling a $84 billion empire that spans from oil and gas and renewable energy to telecom. His conglomerate, Reliance Industries is the largest company by market cap in India.