But despite its long history, we’ve only recently started to rely on solar energy as a renewable power source. This Our World in Data visualization pulls data from BP’s Statistical Review of World Energy to highlight how solar energy consumption per capita has grown in countries around the world over 54 years.
Solar Success: The Top Consumers Per Capita
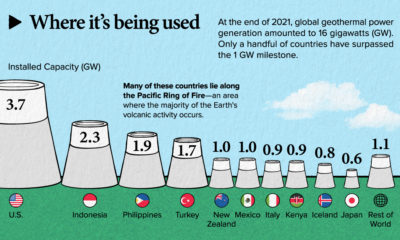
Solar energy consumption is measured in kilowatt hours (kWh)—and as of the latest estimates, Australia leads the world in terms of highest solar energy consumption per capita at 1,764 kWh in 2019. A combination of factors help achieve this:
Optimal weather conditions High gross domestic product (GDP) per capita Tariffs incentivizing the shift to solar
In fact, government subsidies such as financial assistance with installation and feed-in tariffs help bring down the costs of residential solar systems to a mere AUD$1 (US$0.70) per watt. Source: Our World in Data, BP Statistical Review of World Energy 2020 Note that some conversions have been made for primary energy consumption values from Gigajoules (GJ) to kWh. Coming in second place, Japan has the highest share of solar (3.59%) compared to its total primary energy consumption per capita. After the Fukushima nuclear disaster in 2011, the nation made plans to double its renewable energy use by 2030. Japan has achieved its present high rates of solar energy use through creative means, from repurposing abandoned golf courses to building floating “solar islands”.
Solar Laggards: The Bottom Consumers Per Capita
On the flip side, several countries that lag behind on solar use are heavily reliant on fossil fuels. These include several members of OPEC—Iraq, Iran, and Venezuela—and former member state Indonesia. This reliance may also explain why, despite being located in regions that receive the most annual “sunshine hours” in the world, this significant solar potential is yet unrealized. Source: Our World in Data, BP Statistical Review of World Energy 2020 Note that some conversions have been made for primary energy consumption values from Gigajoules (GJ) to kWh. Interestingly, Iceland is on this list for a different reason. Although the country still relies on renewable energy, it gets this from different sources than solar—a significant share comes from hydropower as well as geothermal power.
The Future of Solar
One thing the visualization above makes clear is that solar’s impact on the global energy mix has only just begun. As the costs associated with producing solar power continue to fall, we’re on a steady track to transform solar energy into a more significant means of generating power. All in all, with the world’s projected energy mix from total renewables set to increase over 300% by 2040, solar energy is on a rising trend upwards. on
#1: High Reliability
Nuclear power plants run 24/7 and are the most reliable source of sustainable energy. Nuclear electricity generation remains steady around the clock throughout the day, week, and year. Meanwhile, daily solar generation peaks in the afternoon when electricity demand is usually lower, and wind generation depends on wind speeds.As the use of variable solar and wind power increases globally, nuclear offers a stable and reliable backbone for a clean electricity grid.
#2: Clean Electricity
Nuclear reactors use fission to generate electricity without any greenhouse gas (GHG) emissions.Consequently, nuclear power is the cleanest energy source on a lifecycle basis, measured in CO2-equivalent emissions per gigawatt-hour (GWh) of electricity produced by a power plant over its lifetime. The lifecycle emissions from a typical nuclear power plant are 273 times lower than coal and 163 times lower than natural gas. Furthermore, nuclear is relatively less resource-intensive, allowing for lower supply chain emissions than wind and solar plants.
#3: Stable Affordability
Although nuclear plants can be expensive to build, they are cost-competitive in the long run. Most nuclear plants have an initial lifetime of around 40 years, after which they can continue operating with approved lifetime extensions. Nuclear plants with lifetime extensions are the cheapest sources of electricity in the United States, and 88 of the country’s 92 reactors have received approvals for 20-year extensions. Additionally, according to the World Nuclear Association, nuclear plants are relatively less susceptible to fuel price volatility than natural gas plants, allowing for stable costs of electricity generation.
#4: Energy Efficiency
Nuclear’s high energy return on investment (EROI) exemplifies its exceptional efficiency. EROI measures how many units of energy are returned for every unit invested in building and running a power plant, over its lifetime. According to a 2018 study by Weissbach et al., nuclear’s EROI is 75 units, making it the most efficient energy source by some distance, with hydropower ranking second at 35 units.
#5: Sustainable Innovation
New, advanced reactor designs are bypassing many of the difficulties faced by traditional nuclear plants, making nuclear power more accessible.
Small Modular Reactors (SMRs) are much smaller than conventional reactors and are modular—meaning that their components can be transported and assembled in different locations. Microreactors are smaller than SMRs and are designed to provide electricity in remote and small market areas. They can also serve as backup power sources during emergencies.
These reactor designs offer several advantages, including lower initial capital costs, portability, and increased scalability.
A Nuclear-Powered Future
Nuclear power is making a remarkable comeback as countries work to achieve climate goals and ultimately, a state of energy utopia. Besides the 423 reactors in operation worldwide, another 56 reactors are under construction, and at least 69 more are planned for construction. Some nations, like Japan, have also reversed their attitudes toward nuclear power, embracing it as a clean and reliable energy source for the future. CanAlaska is a leading exploration company in the Athabasca Basin, the Earth’s richest uranium depository. Click here to learn more now. In part 3 of the Road to Energy Utopia series, we explore the unique properties of uranium, the fuel that powers nuclear reactors.