It’s hard to ignore a bet by a powerful investment bank such as Goldman. We are mere mortals in the pecking order, and they are supposed to be the all-knowing smart money from Wall Street. Do we buy the stock, or is it simply wiser to pass?
Bank Performance Overall
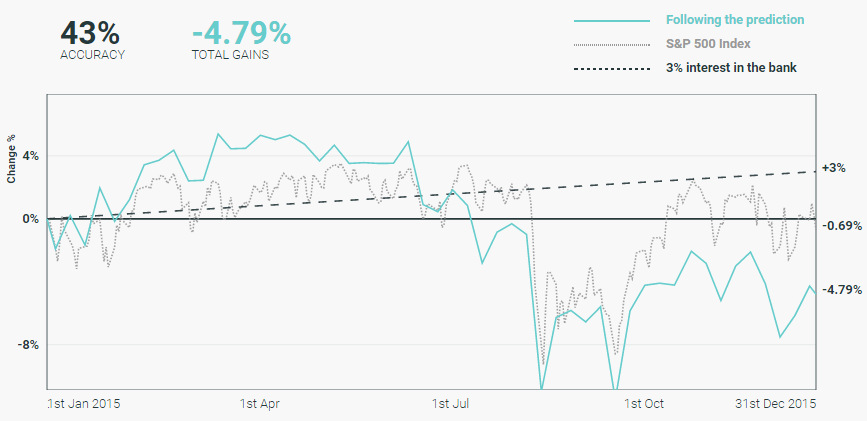
The folks at InterTrader have done considerable legwork to dive deep into the data on investment bank recommendations made in 2015. They looked at every bet made by the 16 top banks throughout the year to assess both potential returns and accuracy. The results are pretty underwhelming. If you bought every stock recommended and held until the end of the year, here’s what your performance would look like:
Overall, when holding the stock picks for the year, banks were only 43% accurate with their predictions. That’s right – flipping a coin would have been potentially more effective than buying bank stock picks, which ended up down -4.79% on the year. The S&P 500 finished down only -0.69%, but simply just making any interest in a savings account would have been more effective as well.
A Closer Look at Individual Banks
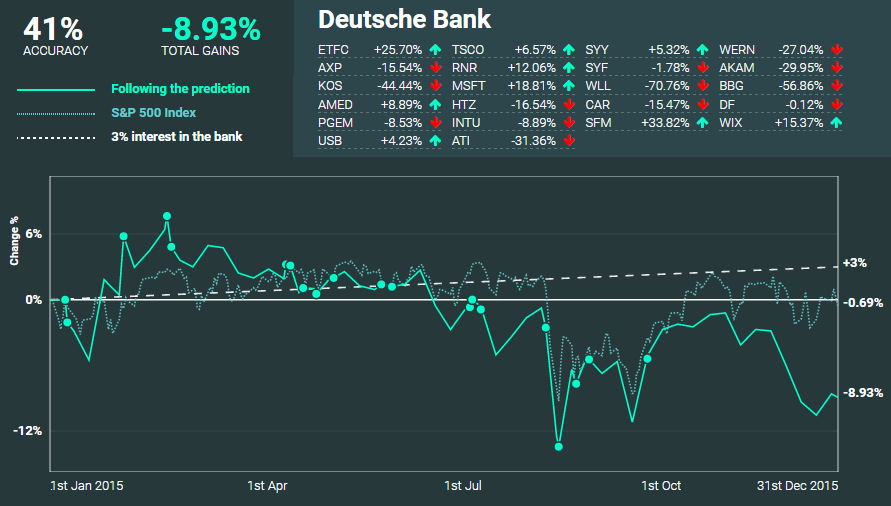
While banks as a whole struggled with picks in 2015, it’s also important to look at banks on a more micro level to see how they performed. Here’s a look at the recommendations by Deutsche Bank, and how they did:
Deutsche Bank nailed 41% of their predictions, and had a -8.93% return if picks were held throughout the year. As you can see, some of their picks such as Microsoft and Wix.com gained double digits. On the other hand, recommendations such as Whiting Petroleum got absolutely crushed throughout the year, dropping -70.1%. Overall, Deutsche Bank’s performance here definitely didn’t do much to help the struggling company get out of its rut.
Which Banks Were Most Accurate?
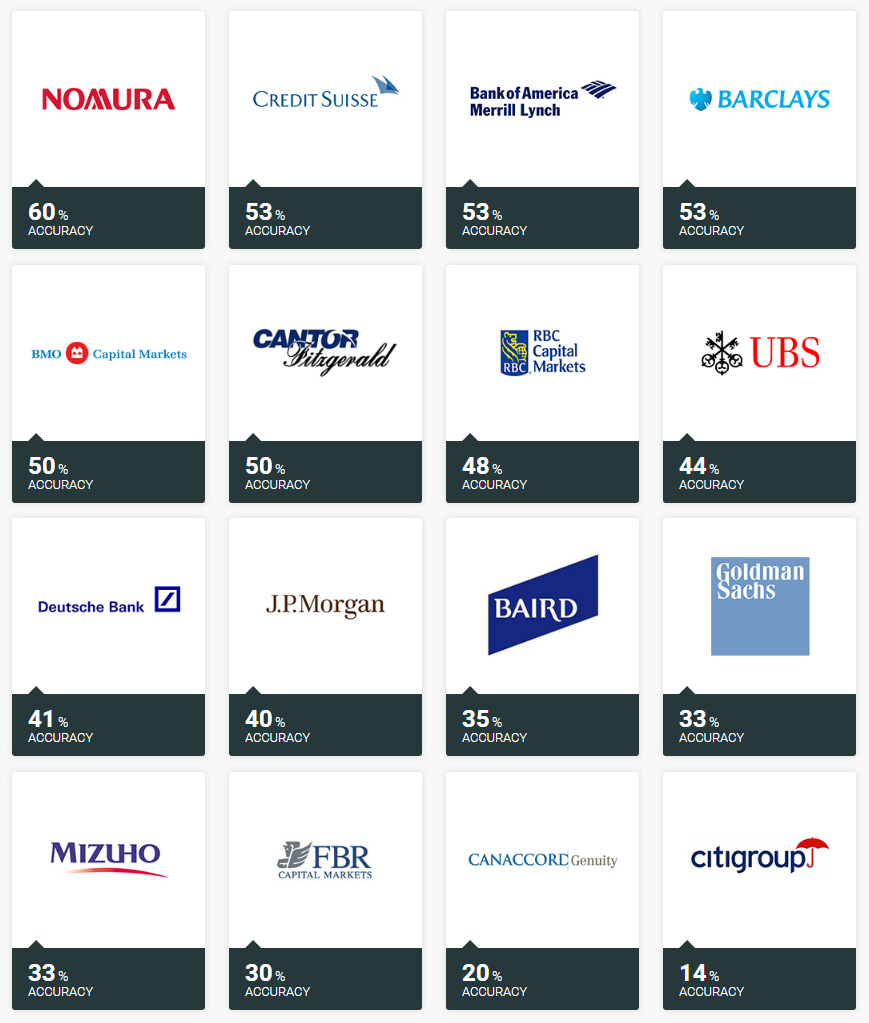
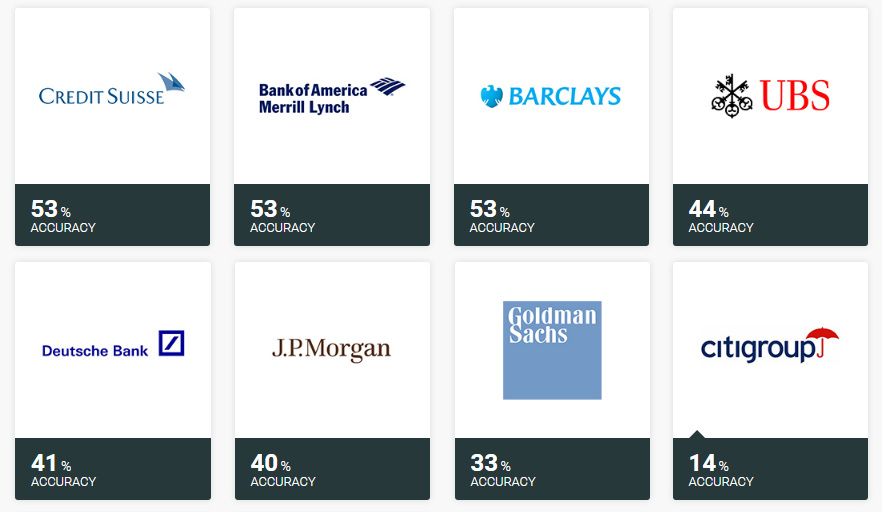
Here are the banks, from best to worst, based on accuracy of their calls:
Nomura, Credit Suisse, BAML, and Barclays all batted above .500 if stocks were held throughout the year, while 10 banks all did worse than a coin flip. Citigroup had an off year, only nailing 14% of its picks.
Which Banks Had the Best Returns?
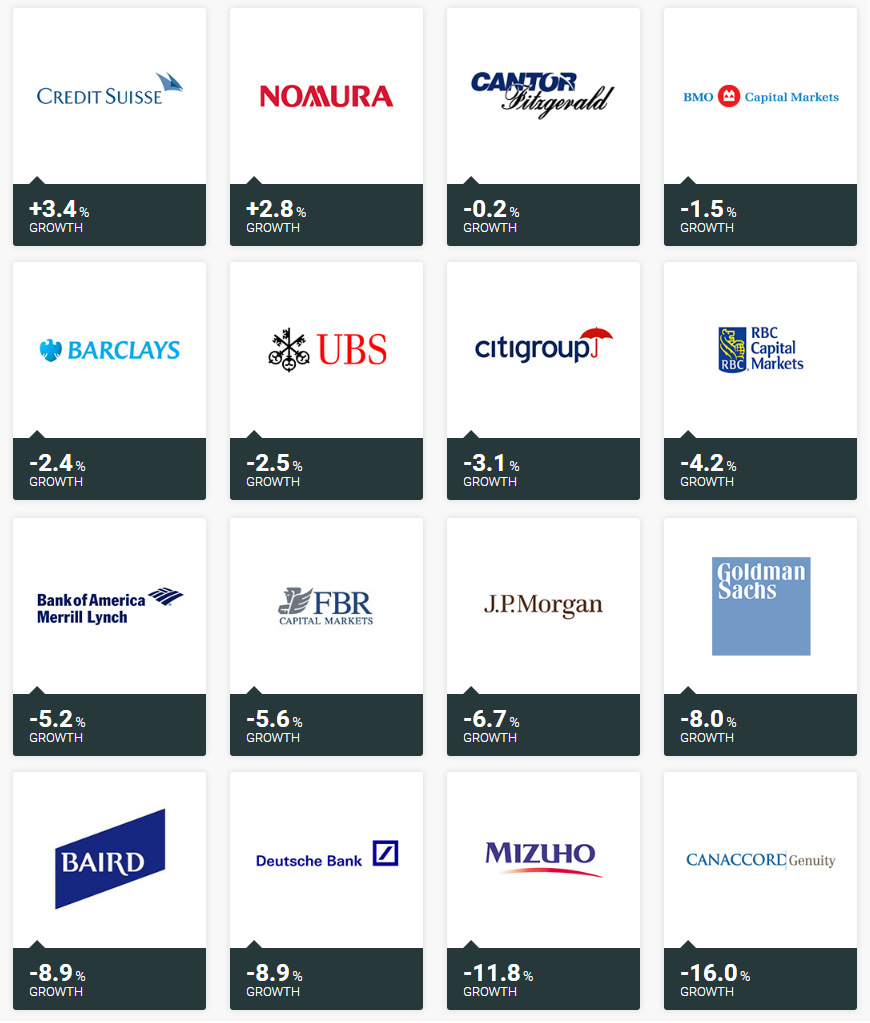
Here are the banks, from best to worst, based on the performance of these recommendations:
Just two banks, Credit Suisse and Nomura, had positive returns if stocks were held through the year. Meanwhile, Canaccord Genuity’s picks were knocked down -16% over the course of 2015.
An Important Caveat
Throughout the above article, we are showing the results if stock picks were held from when they were made until the end of the year. However, it is worth noting that the investment banks actually did slightly better if picks were held for shorter durations of time: In other words – if you sold all stock recommendations exactly 30 days after buying, you would have actually made a 0.8% return throughout the year. This is still a lower return than a savings account, but it is an improvement on losing -4.79%! For a more in-depth dive into the data, we highly recommend checking out InterTrader’s interactive version of the results.
on The good news is that the Federal Reserve, U.S. Treasury, and Federal Deposit Insurance Corporation are taking action to restore confidence and take the appropriate measures to help provide stability in the market. With this in mind, the above infographic from New York Life Investments looks at the factors that impact bonds, how different types of bonds have historically performed across market environments, and the current bond market volatility in a broader context.
Bond Market Returns
Bonds had a historic year in 2022, posting one of the worst returns ever recorded. As interest rates rose at the fastest pace in 40 years, it pushed bond prices lower due to their inverse relationship. In a rare year, bonds dropped 13%.
Source: FactSet, 01/02/2023.
Bond prices are only one part of a bond’s total return—the other looks at the income a bond provides. As interest rates have increased in the last year, it has driven higher bond yields in 2023.
Source: YCharts, 3/20/2023.
With this recent performance in mind, let’s look at some other key factors that impact the bond market.
Factors Impacting Bond Markets
Interest rates play a central role in bond market dynamics. This is because they affect a bond’s price. When rates are rising, existing bonds with lower rates are less valuable and prices decline. When rates are dropping, existing bonds with higher rates are more valuable and their prices rise. In March, the Federal Reserve raised rates 25 basis points to fall within the 4.75%-5.00% range, a level not seen since September 2007. Here are projections for where the federal funds rate is headed in 2023:
Federal Reserve Projection*: 5.1% Economist Projections**: 5.3%
*Based on median estimates in the March summary of quarterly economic projections.**Projections based on March 10-15 Bloomberg economist survey. Together, interest rates and the macroenvironment can have a positive or negative effect on bonds.
Positive
Here are three variables that may affect bond prices in a positive direction:
Lower Inflation: Reduces likelihood of interest rate hikes. Lower Interest Rates: When rates are falling, bond prices are typically higher. Recession: Can prompt a cut in interest rates, boosting bond prices.
Negative
On the other hand, here are variables that may negatively impact bond prices:
Higher Inflation: Can increase the likelihood of the Federal Reserve to raise interest rates. Rising Interest Rates: Interest rate hikes lead bond prices to fall. Weaker Fundamentals: When a bond’s credit risk gets worse, its price can drop. Credit risk indicates the chance of a default, the risk of a bond issuer not making interest payments within a given time period.
Bonds have been impacted by these negative factors since inflation started rising in March 2021.
Fixed Income Opportunities
Below, we show the types of bonds that have had the best performance during rising rates and recessions.
Source: Derek Horstmeyer, George Mason University 12/3/2022. As we can see, U.S. ultrashort bonds performed the best during rising rates. Mortgage bonds outperformed during recessions, averaging 11.4% returns, but with higher volatility. U.S. long-term bonds had 7.7% average returns, the best across all market conditions. In fact, they were also a close second during recessions. When rates are rising, ultrashort bonds allow investors to capture higher rates when they mature, often with lower historical volatility.
A Closer Look at Bond Market Volatility
While bond market volatility has jumped this year, current dislocations may provide investment opportunities. Bond dislocations allow investors to buy at lower prices, factoring in that the fundamental quality of the bond remains strong. With this in mind, here are two areas of the bond market that may provide opportunities for investors:
Investment-Grade Corporate Bonds: Higher credit quality makes them potentially less vulnerable to increasing interest rates. Intermediate Bonds (2-10 Years): Allow investors to lock in higher rates.
Both types of bonds focus on quality and capturing higher yields when faced with challenging market conditions.
Finding the Upside
Much of the volatility seen in the banking sector was due to banks buying bonds during the pandemic—or even earlier—at a time when interest rates were historically low. Since then, rates have climbed considerably. Should rates moderate or stop increasing, this may present better market conditions for bonds. In this way, today’s steep discount in bond markets may present an attractive opportunity for price appreciation. At the same time, investors can potentially lock in strong yields as inflation may subside in the coming years ahead. Learn more about bond investing strategies with New York Life Investments.