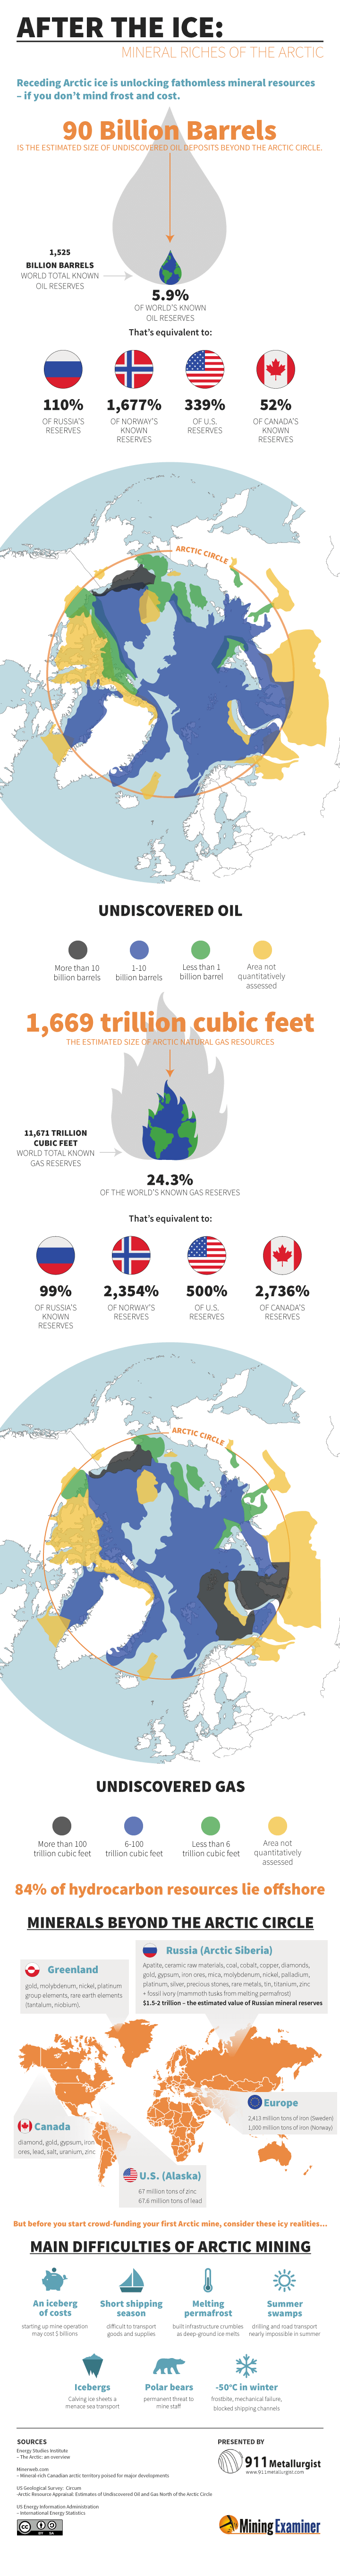
The Energy and Mineral Riches of the Arctic
The Arctic has been the fascination of many people for centuries. Hundreds of years ago, the Europeans saw the Arctic’s frigid waters as a potential gateway to the Pacific. The region has also been home to many unique native cultures such as the Inuits and Chukchi. Lastly, it goes without saying that the Arctic is unsurpassed in many aspects of its natural beauty, and lovers of the environment are struck by the region’s millions of acres of untouched land and natural habitats. However, the Arctic is also one of the last frontiers of natural resource discovery, and underneath the tundra and ice are vast amounts of undiscovered oil, natural gas, and minerals. That’s why there is a high-stakes race for Arctic domination between countries such as the United States, Norway, Russia, Denmark, and Canada. Today’s infographic highlights the size of some of these resources in relation to global reserves to help create context around the potential significance of this untapped wealth. In terms of oil, it’s estimated that the Arctic has 90 billion barrels of oil that is yet to be discovered. That’s equal to 5.9% of the world’s known oil reserves – about 110% of Russia’s current oil reserves, or 339% of U.S. reserves. For natural gas, the potential is even higher: the Arctic has an estimated 1,669 trillion cubic feet of gas, equal to 24.3% of the world’s current known reserves. That’s equal to 500% of U.S. reserves, 99% of Russia’s reserves, or 2,736% of Canada’s natural gas reserves. Most of these hydrocarbon resources, about 84%, are expected to lay offshore. There are also troves of metals and minerals, including gold, diamonds, copper, iron, zinc, and uranium. However, these are not easy to get at. Starting a mine in the Arctic can be an iceberg of costs: short shipping seasons, melting permafrost, summer swamps, polar bears, and -50 degree temperatures make the Arctic tough to be economic. Original graphic by: 911 Metallurgist
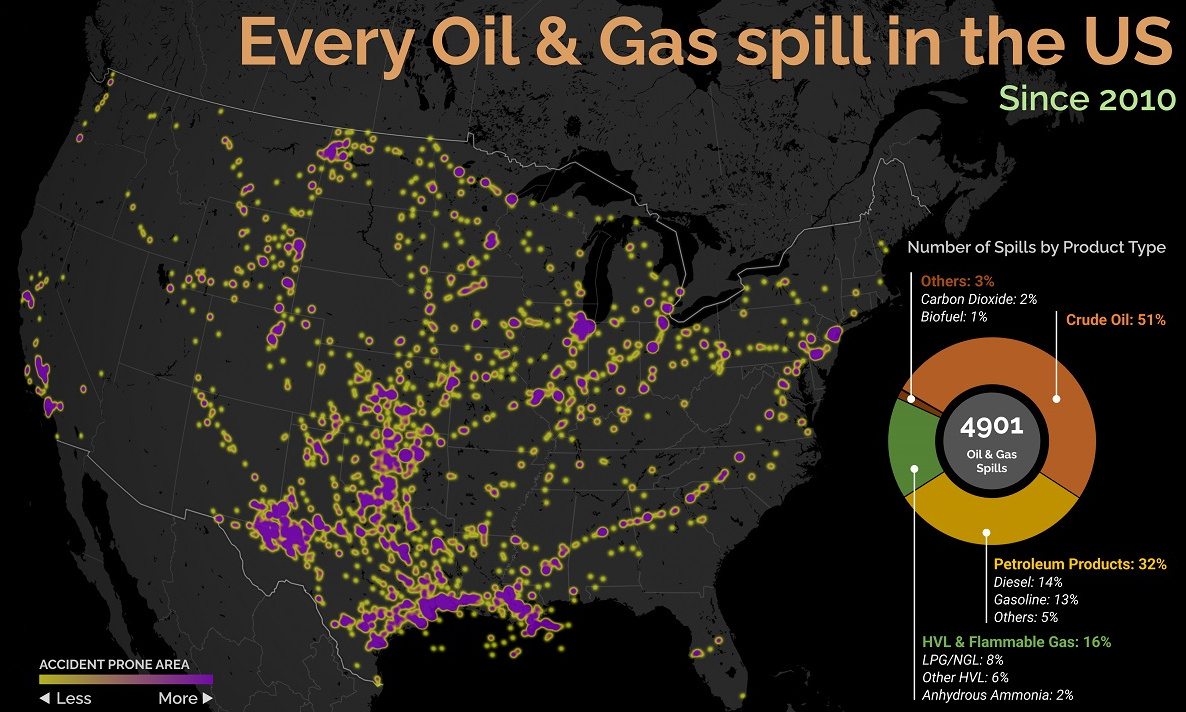
on Aside from the obvious climate impact they bring, one other downside in particular is spills, which can lead to ecological and economic damage. These can happen due to pipeline leaks, train derailments, or other industrial disasters. This graphic from Preyash Shah provides a visual overview of every oil and gas spill in the contiguous U.S. since 2010. Data is tracked by the U.S. government’s Pipeline and Hazardous Materials Safety Administration (PHMSA).
U.S. Oil and Gas Spills (2010‒2022)
The majority of spills that have occurred come mostly from crude oil, followed by petroleum products and gas. Note that this data covers the quantity of spills and not damages or volume.
Crude oil, which makes up just over half of documented spills, is also one of the most costly. Contaminations can persist for years after a spill, and its impact on local mammals and waterfowl is particularly harsh. This has been the case with the Deepwater Horizon spill (also known as the “BP oil spill”), which experts say is still causing harm in the Gulf of Mexico. Other products with lots of spills include petroleum products such as diesel or gasoline, as well as liquefied natural gas or other volatile liquids. Interestingly, liquefied carbon dioxide can also be transported in pipelines, commonly used for carbon capture storage, but requires high pressure to maintain its state. When looking at the location of spills, it’s clear that the South Central states have experienced the highest number of disasters. In contrast, the West Coast has had substantially less activity. However, this makes much more sense when looking at the dominant oil producing states, where Texas and surrounding neighbors reign supreme. Of the 4,901 spills during this period, Texas accounts for 1,936 or roughly 40% of all oil and gas spills. This is followed by Oklahoma, which has had 407 spills and is one of the largest net exporters of oil and gas in the country.
What Causes Spills?
Oil and gas spills actually have a surprisingly long history, with one of the earliest dating back to 1889, when a spill was reported on the coast between Los Angeles and San Diego. Causes have consisted primarily of weather, natural disasters, equipment and technological malfunction, as well as human error. However, they only became a widespread problem around the halfway mark of the 20th century, when petroleum extraction and production really began to take off. This era also saw the emergence of supertankers, which can transport half a million tons of oil but therefore make the risk of spills even costlier. In fact, the biggest spill off U.S. waters after the Deepwater Horizon disaster is the 1989 Exxon Valdez spill in Alaska, when a tanker crashed into a reef and 11 million gallons of oil spilled into the Pacific Ocean.