Demand for the energy source really started to soar during the Industrial Revolution, and it continues to power some of the world’s largest economies today. However, as the clean energy revolution heats up, will coal continue to be a viable option? Today’s data visualization from Carbon Brief maps the changing number of global coal power plants operating between 2000 and 2018. The interactive timeline pulls from the Global Coal Plant Tracker’s latest data and features around 10,000 retired, operating, and planned coal units, totaling close to 3,000 gigawatts (GW) of capacity across 95 countries. On the map, each circular icon’s size represents each plant’s coal capacity in megawatts (MW). The data also highlights the type of coal burned and the CO₂ emissions produced as a result.
A Precarious Power Source
Throughout its history, coal has been used for everything from domestic heating and steel manufacturing, to railways, gas works, and electricity. The fuel played a pivotal role in powering economic development, and had a promising future with a flurry of plant openings. However, in 2016, coal output dropped by 231 million tons of oil equivalent (Mtoe). Combined with a rapid slowdown of new plants being built, total coal units operating around the world fell for the first time in 2018. With the remaining fleet of plants operating fewer hours than ever, plant closures have been triggered in South Africa, India, and China—steadily eroding coal’s bottom line. Industry trends have also forced a wave of coal companies to recently declare bankruptcy, including giants such as Peabody Energy and Alpha Natural.
Can Coal Compete with Clean Energy?
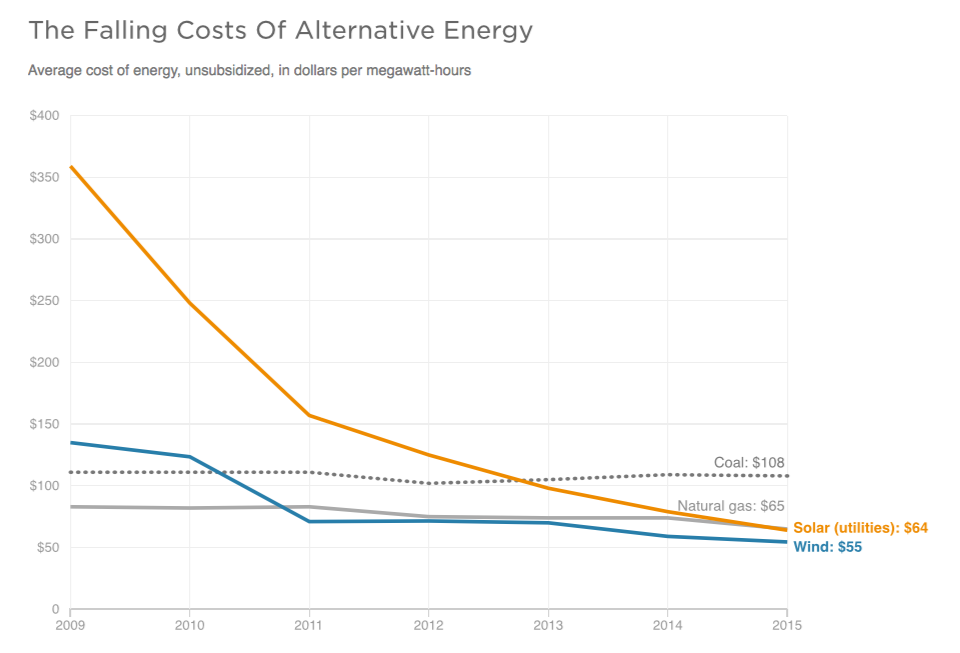
Today, coal is experiencing fierce competition from low-priced natural gas and ever-cheaper renewable power—most notably from wind and solar. Further, solar power costs will continue to decline each year and be cut in half by 2020, relative to 2015 figures.
Source: Lazard Natural gas surpassed coal as America’s #1 power source in 2016, with the total share of power generated from coal tumbling from 45% in 2010 to 28% in 2018. By next year, the role of coal is expected to be further reduced to 24% of the mix. On the interactive visualization, the decline of coal is especially evident in 2018 as plant closures sweep across the map. The chart shows how several countries, notably China and India, have been closing many hundreds of smaller, older, and less efficient units, but replacing them with larger and more efficient models. As of today, China retains the largest fleet of coal plants, consuming a staggering 45% of the world’s coal. Use the above slider to see the difference between China’s coal plants in 2000 with projected future capacity.
Towards a New Reality
Coal is the most carbon intensive fossil fuel, and for every tonne of coal burned there are approximately 2.5 tonnes of carbon emissions. The International Energy Agency states that all unabated coal must be phased out within a few decades if global warming is to be limited. Despite these warnings, global coal demand is set to remain stable for the next five years, with declines in the U.S. and Europe offset by immediate growth in India and China. The latter are the main players in the global coal market, but will eventually see a gradual decline in demand as they move away from industrialization. A total phaseout of unabated coal is planned by 14 of the world’s 78 coal-powered countries, with many of these countries working to convert coal capacity to natural gas. As the price of premium solar generation drops steadily, and innovation in renewable energy technology becomes more prominent, the world is shifting its attention to a clean energy economy. A global revival of coal looks less and less likely—and the fossil fuel might very well one day become obsolete. Editor’s Note: The map uses WebGL and will not work on some older browsers. The map may also fail to load if you are using an ad-blocking browser plugin. on
#1: High Reliability
Nuclear power plants run 24/7 and are the most reliable source of sustainable energy. Nuclear electricity generation remains steady around the clock throughout the day, week, and year. Meanwhile, daily solar generation peaks in the afternoon when electricity demand is usually lower, and wind generation depends on wind speeds.As the use of variable solar and wind power increases globally, nuclear offers a stable and reliable backbone for a clean electricity grid.
#2: Clean Electricity
Nuclear reactors use fission to generate electricity without any greenhouse gas (GHG) emissions.Consequently, nuclear power is the cleanest energy source on a lifecycle basis, measured in CO2-equivalent emissions per gigawatt-hour (GWh) of electricity produced by a power plant over its lifetime. The lifecycle emissions from a typical nuclear power plant are 273 times lower than coal and 163 times lower than natural gas. Furthermore, nuclear is relatively less resource-intensive, allowing for lower supply chain emissions than wind and solar plants.
#3: Stable Affordability
Although nuclear plants can be expensive to build, they are cost-competitive in the long run. Most nuclear plants have an initial lifetime of around 40 years, after which they can continue operating with approved lifetime extensions. Nuclear plants with lifetime extensions are the cheapest sources of electricity in the United States, and 88 of the country’s 92 reactors have received approvals for 20-year extensions. Additionally, according to the World Nuclear Association, nuclear plants are relatively less susceptible to fuel price volatility than natural gas plants, allowing for stable costs of electricity generation.
#4: Energy Efficiency
Nuclear’s high energy return on investment (EROI) exemplifies its exceptional efficiency. EROI measures how many units of energy are returned for every unit invested in building and running a power plant, over its lifetime. According to a 2018 study by Weissbach et al., nuclear’s EROI is 75 units, making it the most efficient energy source by some distance, with hydropower ranking second at 35 units.
#5: Sustainable Innovation
New, advanced reactor designs are bypassing many of the difficulties faced by traditional nuclear plants, making nuclear power more accessible.
Small Modular Reactors (SMRs) are much smaller than conventional reactors and are modular—meaning that their components can be transported and assembled in different locations. Microreactors are smaller than SMRs and are designed to provide electricity in remote and small market areas. They can also serve as backup power sources during emergencies.
These reactor designs offer several advantages, including lower initial capital costs, portability, and increased scalability.
A Nuclear-Powered Future
Nuclear power is making a remarkable comeback as countries work to achieve climate goals and ultimately, a state of energy utopia. Besides the 423 reactors in operation worldwide, another 56 reactors are under construction, and at least 69 more are planned for construction. Some nations, like Japan, have also reversed their attitudes toward nuclear power, embracing it as a clean and reliable energy source for the future. CanAlaska is a leading exploration company in the Athabasca Basin, the Earth’s richest uranium depository. Click here to learn more now. In part 3 of the Road to Energy Utopia series, we explore the unique properties of uranium, the fuel that powers nuclear reactors.