Whether it is for a simple top up for your smartphone battery at the airport or the continuous energy chug of household appliances, it’s easy to take the electricity we use for granted. But do you know where your electricity comes from – and whether it is green or not?
Drilling Down by State and Province
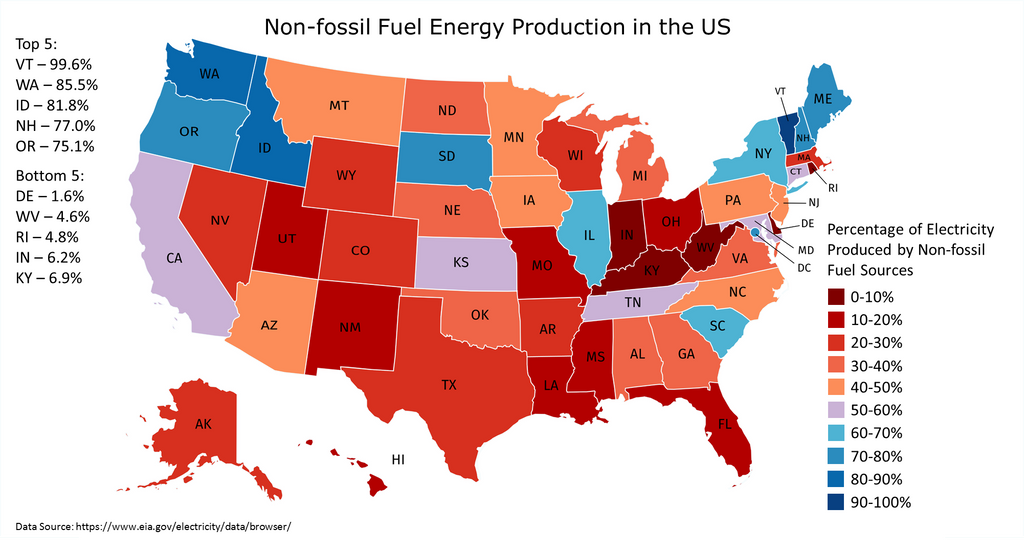
Today’s maps come from Reddit users Dr_Engineerd and PaulsEggo, who have used data from national energy administration agencies for the U.S. and Canada to show what percentage of electricity generated in each state or province is green. Let’s start with the map of the United States:
The above map combines electricity generation for all renewable forms of energy (such as solar, wind, geothermal, or hydro) with nuclear, which is considered a sustainable energy source by many experts. The top five states are as follows: Vermont leads the way with an impressive 99.6% mix for electricity generated. Also notable is New Hampshire, which makes the list thanks to its heavy usage of nuclear – the state’s Seabrook nuclear plant (1,244 MW) is the largest individual electrical generating unit on the New England power grid. Now, here are the bottom five states: West Virginia, Kentucky, and Indiana still get the majority of their electricity from coal. That’s not to say states like Indiana have not been investing in green power – the state actually ranks 12th in the U.S. for wind capacity. It’s just not enough to make a dent in the larger energy mix.
A Look Up North
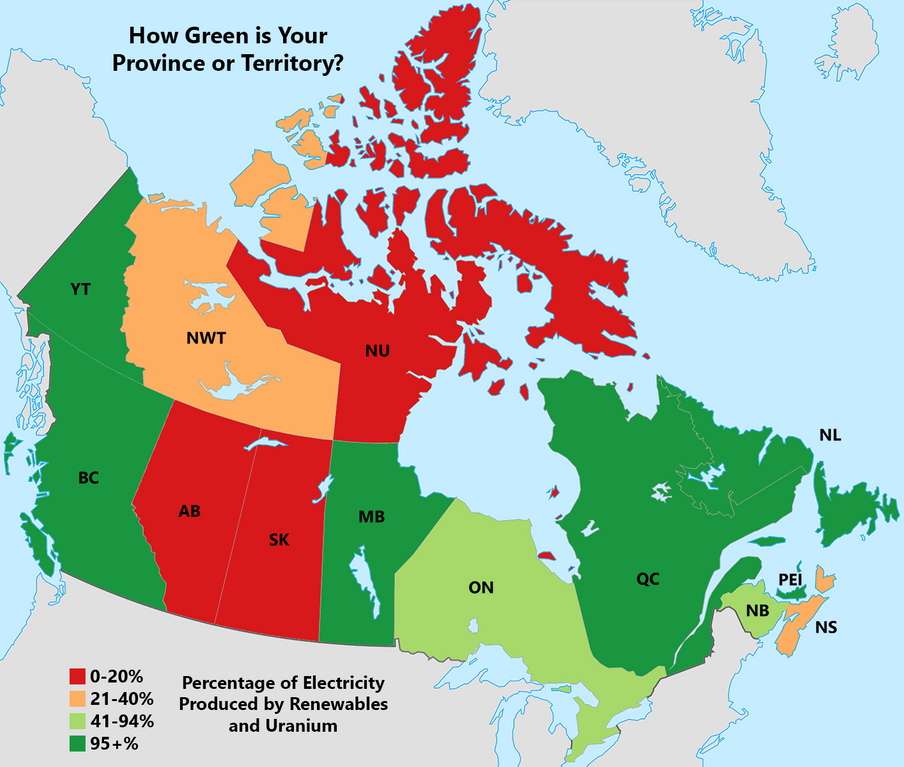
Finally, here’s a similar look, but this time at Canadian provinces and territories:
Regions like British Columbia, Manitoba, Yukon, Newfoundland, and Quebec are known for their hydro power – all get over 85% of their electricity from hydro alone. Meanwhile, Prince Edward Island gets the vast majority of its power from wind. On the flipside, the only three provinces or territories below the 20% green threshold are Alberta, Saskatchewan, and Nunavut.
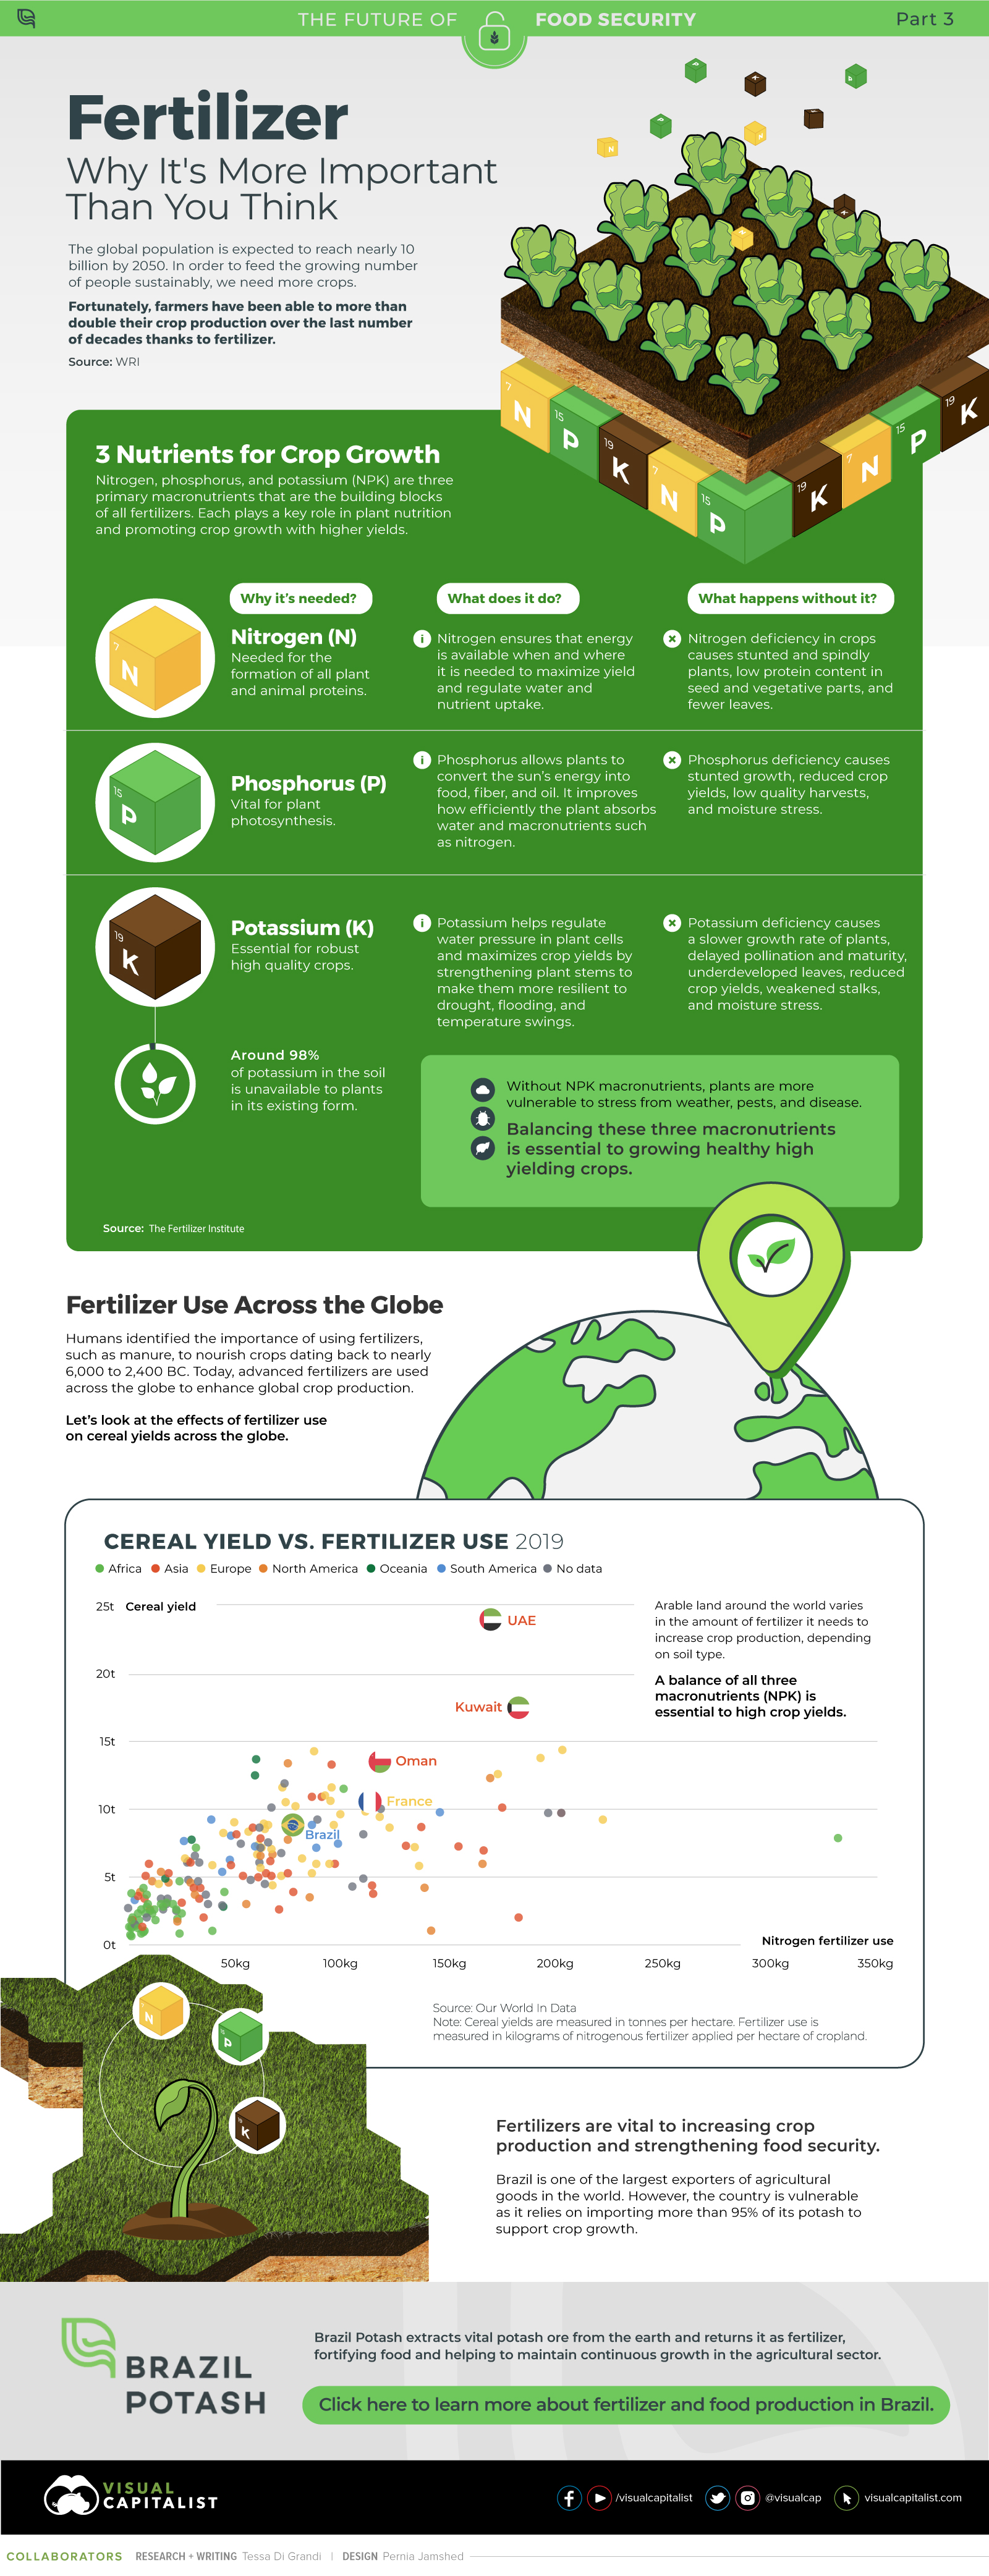
on Over recent decades, farmers have been able to more than double their production of crops thanks to fertilizers and the vital nutrients they contain. When crops are harvested, the essential nutrients are taken away with them to the dining table, resulting in the depletion of these nutrients in the soil. To replenish these nutrients, fertilizers are needed, and the cycle continues. The above infographic by Brazil Potash shows the role that each macronutrient plays in growing healthy, high-yielding crops.
Food for Growth
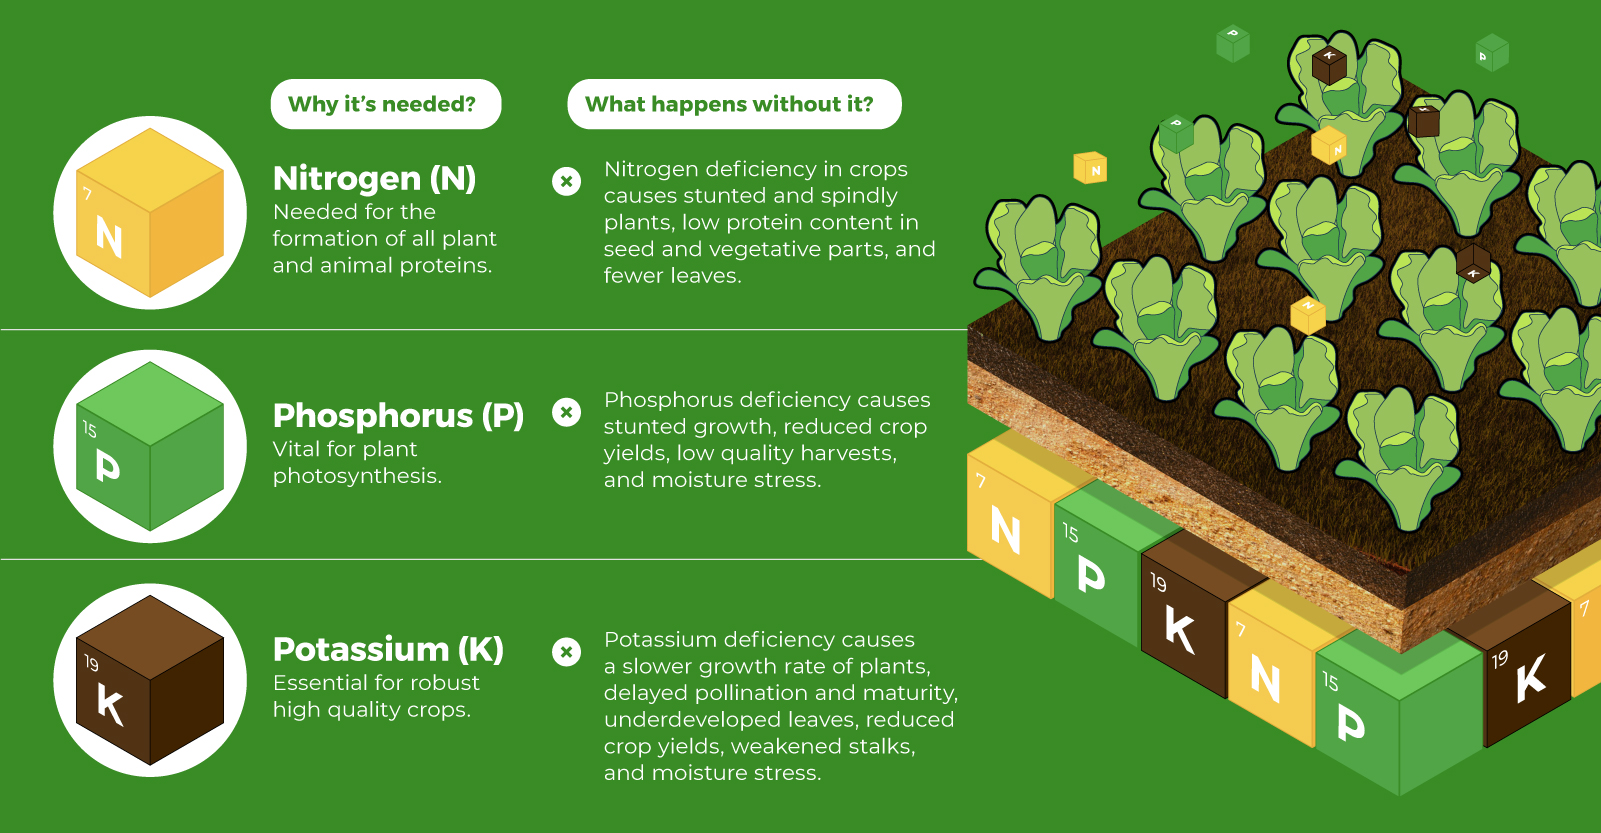
Nitrogen, phosphorus, and potassium (NPK) are three primary macronutrients that are the building blocks of the global fertilizer industry. Each plays a key role in plant nutrition and promoting crop growth with higher yields. Let’s take a look at how each macronutrient affects plant growth. If crops lack NPK macronutrients, they become vulnerable to various stresses caused by weather conditions, pests, and diseases. Therefore, it is crucial to maintain a balance of all three macronutrients for the production of healthy, high-yielding crops.
The Importance of Fertilizers
Humans identified the importance of using fertilizers, such as manure, to nourish crops dating back to nearly 6,000 to 2,400 BC. As agriculture became more intensive and large-scale, farmers began to experiment with different types of fertilizers. Today advanced chemical fertilizers are used across the globe to enhance global crop production. There are a myriad of factors that affect soil type, and so the farmable land must have a healthy balance of all three macronutrients to support high-yielding, healthy crops. Consequently, arable land around the world varies in the amount and type of fertilizer it needs. Fertilizers play an integral role in strengthening food security, and a supply of locally available fertilizer is needed in supporting global food systems in an ever-growing world. Brazil is one of the largest exporters of agricultural goods in the world. However, the country is vulnerable as it relies on importing more than 95% of its potash to support crop growth. Brazil Potash is developing a new potash project in Brazil to ensure a stable domestic source of this nutrient-rich fertilizer critical for global food security. Click here to learn more about fertilizer and food production in Brazil.