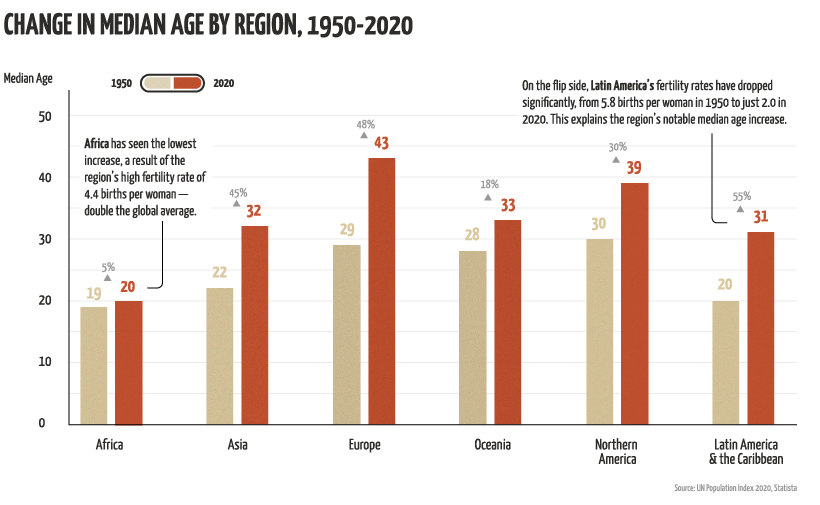
Yet, despite an overall increase globally, not all regions have aged at the same rate. For instance, Europe’s median age has grown by 14 years, while Africa’s has only increased by 1 year. Today’s animated map uses data from the UN Population Index to highlight the changes in median age over the last 70 years, and to visualize the differences between each region. We also explain why some regions skew older than others.
Factors that Affect a Region’s Median Age
Before diving into the numbers, it’s important to understand the key factors that influence a region’s median age:
The Change in Median Age
As mentioned, not all regions are created equal. Here’s how much the median age has changed in each region since 1950:
The Highs
Regions that have seen the most growth and generally skew older are Latin America, followed by Europe and Asia. Interestingly, Asia’s notable increase is largely influenced by Japan, which has the oldest population on the planet. The country has seen a significant increase in median age since 1950—it’s gone from 22 to 48 years in 2020. This can be explained by its considerably low fertility rate, which is 1.4 births per woman—that’s less than half the global average. But why is Japan’s fertility rate so low? There are more women in the workforce than ever before, and they are too busy to take on the burden of running a household. Yet, while women are more prosperous than ever, the workforce in general has taken a hit. Japan’s recession in the early 1990s led to an increase in temporary jobs, which has had lasting effects on the region’s workforce—in 2019, about 1 in 5 men were working contract jobs with little stability or job growth.
The Lows
In contrast to Asia’s growth, Africa has seen the lowest increase in median age. The region’s population skews young, with over 60% of its population under the age of 25. Africa’s young population can be explained by its high birth rate of 4.4 births per woman. It also has a relatively low life expectancy, at 65 years for women and 61 years for men. To put things into perspective, the average life expectancy across the globe is 75 years for women and 70 years for men. Another trend worth noting is Oceania’s relatively small growth. It’s interesting because the region’s fertility rate is almost on par with the global average, at 2.4 births per woman, and the average life expectancy doesn’t differ much from the norm either. The most likely reason for Oceania’s stagnant growth in median age is its high proportion of migrants. In 2019, the country had 8.9 million international migrants, which is 21% of its overall population. In contrast, migrants only make up 10% of North America’s population.
Unique Challenges for Every Region
Age composition has significant impacts on a region’s labor force, health services, and economic productivity. Regions with a relatively high median age face several challenges such as shrinking workforce, higher taxes, and increasing healthcare costs. On the other end of the spectrum, regions with a younger population face increased demand for educational services and a lack of employment opportunities. As our population worldwide continues to grow and age, it’s important to bring attention to issues that impact our global community. World Population Day on July 11, 2020, was established by the UN to try and solve worldwide population issues. – UN Secretary-General António Guterres on Even while political regimes across these countries have changed over time, they’ve largely followed a few different types of governance. Today, every country can ultimately be classified into just nine broad forms of government systems. This map by Truman Du uses information from Wikipedia to map the government systems that rule the world today.
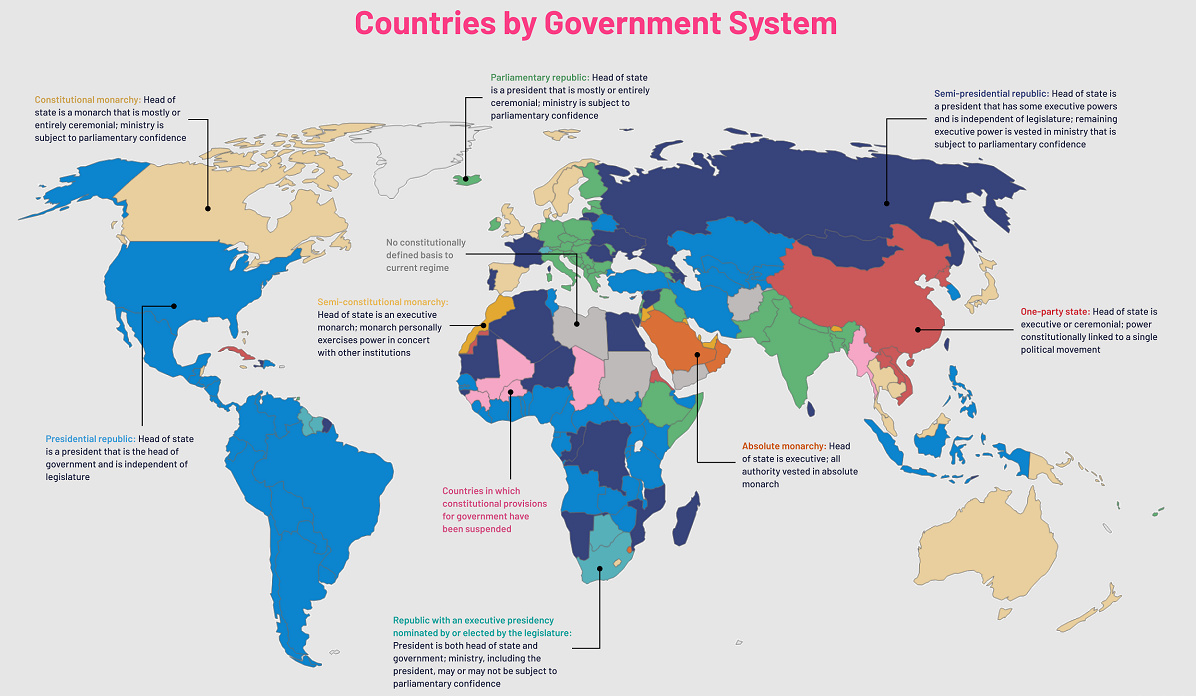
Countries By Type of Government
It’s important to note that this map charts government systems according to each country’s legal framework. Many countries have constitutions stating their de jure or legally recognized system of government, but their de facto or realized form of governance may be quite different. Here is a list of the stated government system of UN member states and observers as of January 2023: Let’s take a closer look at some of these systems.
Monarchies
Brought back into the spotlight after the death of Queen Elizabeth II of England in September 2022, this form of government has a single ruler. They carry titles from king and queen to sultan or emperor, and their government systems can be further divided into three modern types: constitutional, semi-constitutional, and absolute. A constitutional monarchy sees the monarch act as head of state within the parameters of a constitution, giving them little to no real power. For example, King Charles III is the head of 15 Commonwealth nations including Canada and Australia. However, each has their own head of government. On the other hand, a semi-constitutional monarchy lets the monarch or ruling royal family retain substantial political powers, as is the case in Jordan and Morocco. However, their monarchs still rule the country according to a democratic constitution and in concert with other institutions. Finally, an absolute monarchy is most like the monarchies of old, where the ruler has full power over governance, with modern examples including Saudi Arabia and Vatican City.
Republics
Unlike monarchies, the people hold the power in a republic government system, directly electing representatives to form government. Again, there are multiple types of modern republic governments: presidential, semi-presidential, and parliamentary. The presidential republic could be considered a direct progression from monarchies. This system has a strong and independent chief executive with extensive powers when it comes to domestic affairs and foreign policy. An example of this is the United States, where the President is both the head of state and the head of government. In a semi-presidential republic, the president is the head of state and has some executive powers that are independent of the legislature. However, the prime minister (or chancellor or equivalent title) is the head of government, responsible to the legislature along with the cabinet. Russia is a classic example of this type of government. The last type of republic system is parliamentary. In this system, the president is a figurehead, while the head of government holds real power and is validated by and accountable to the parliament. This type of system can be seen in Germany, Italy, and India and is akin to constitutional monarchies. It’s also important to point out that some parliamentary republic systems operate slightly differently. For example in South Africa, the president is both the head of state and government, but is elected directly by the legislature. This leaves them (and their ministries) potentially subject to parliamentary confidence.
One-Party State
Many of the systems above involve multiple political parties vying to rule and govern their respective countries. In a one-party state, also called a single-party state or single-party system, only one political party has the right to form government. All other political parties are either outlawed or only allowed limited participation in elections. In this system, a country’s head of state and head of government can be executive or ceremonial but political power is constitutionally linked to a single political movement. China is the most well-known example of this government system, with the General Secretary of the Communist Party of China ruling as the de facto leader since 1989.
Provisional
The final form of government is a provisional government formed as an interim or transitional government. In this system, an emergency governmental body is created to manage political transitions after the collapse of a government, or when a new state is formed. Often these evolve into fully constitutionalized systems, but sometimes they hold power for longer than expected. Some examples of countries that are considered provisional include Libya, Burkina Faso, and Chad.