Research reveals that when a sustainable ethos is applied to policy and business, it typically bodes well for economies and people alike. By providing benchmarks for those decisions, indexes like Yale’s Environmental Performance Index (EPI) can be critical to measuring national sustainability efforts. The above map interprets the EPI ranking of 180 economies across 32 environmental health indicators by narrowing in on the top 40 greenest countries.
Who’s the Greenest of them All?
Despite the decades-long trend of globalization, national environmental policies have proved to be widely divergent. The EPI report confirms that those policies—and their positive results—are highly correlated with national wealth. This is evidenced in the global EPI distributions, seen below: Regional grouping in the report include: Global West, Asia-Pacific, Eastern Europe, Former Soviet States, Greater Middle East, Latin America & Caribbean, Southern Asia, and Sub-Saharan Africa Scandinavian countries, which tend to have a high GDP per capita, show strong and consistent results across EPI parameters. Denmark for instance—which ranks first overall—leads the world in slowing its growth in CO2 emissions. Meanwhile, neighbor Sweden leads in landfill and recycling treatment, while wastewater treatment is led by a handful of countries within and beyond Scandinavia including Denmark, Finland, the Netherlands, Singapore, and Sweden. In North America, Canada claims top spot in the biodiversity and habitat category, while the U.S. ranks sixth in agricultural diversity globally. In Asia, Singapore leads the world in fishery health and sustainability. Ultimately, it appears the world’s greenest countries tend to focus on all areas of sustainability, while laggard countries show more uneven performance across categories.
What Does “Green” Mean?
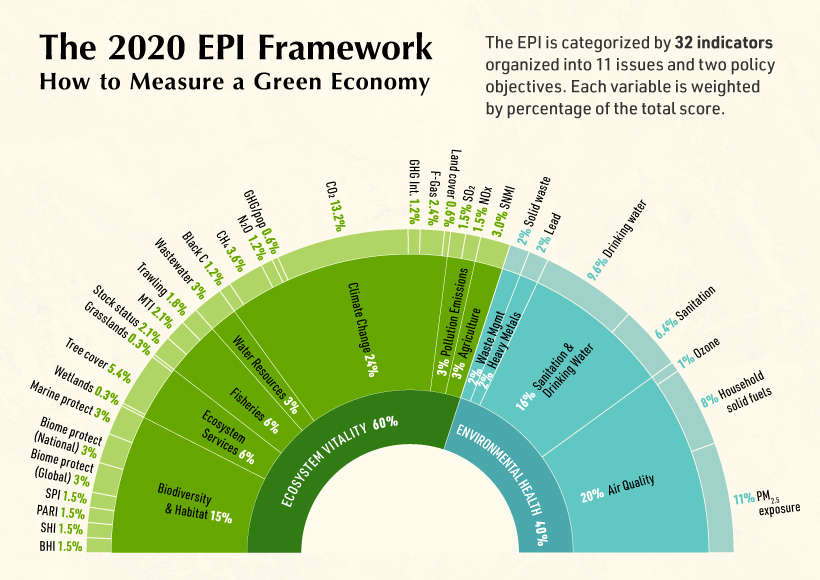
Each high-level performance indicator with the EPI, like “environmental health”, is broken into subsections. Nations are scored on each subsector on a scale up to 100. As a result, multiple countries can rank first in any given category. By evaluating national sustainability on a scale that is unrelated to other nations, we get a clearer idea of comparative national progress, beyond a basic ranking. For instance, 30 countries tie for first in marine protection, all with scores of 100. This shows that many economies are prioritizing this area of sustainability. The EPI categories and subsectors are shown in the diagram below:
Each section is weighted differently, and is reflected as a percentage within the index. For example, Ecosystem Vitality accounts for 60% of the EPI, Climate Change makes up 24% of a country’s score, and CO2 emission reduction is weighted at 13.2%.
The Cost of Being Green
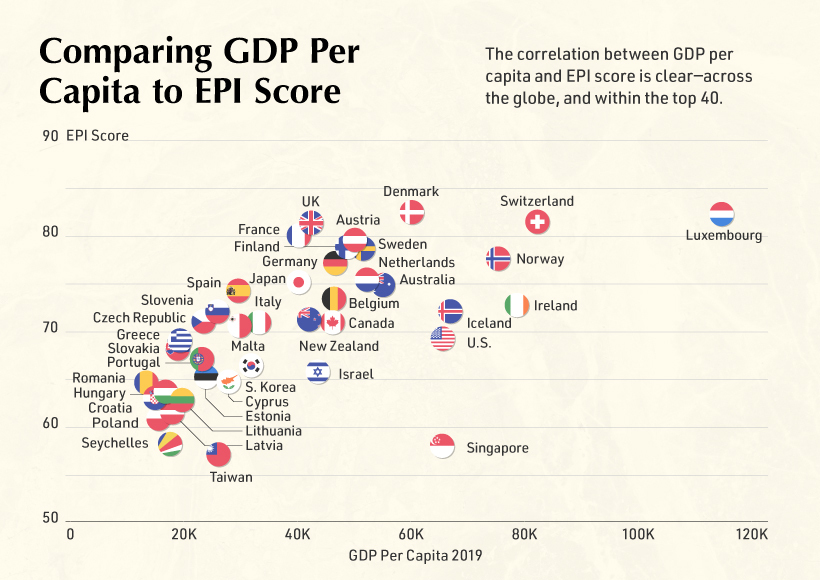
Infrastructure costs are one reason why wealthier nations tend to fare better across sustainability measures. Everything from air pollution reduction and water treatment, to hazardous waste control and mitigation of public health crises are especially expensive—but have a huge potential impact on citizens. This trend can be seen the scatterplot, which demonstrates the distribution of economies evaluated by the EPI:
For a more detailed look, the table below highlights the GDP per capita of each of the top 40 greenest countries, based on data from the World Bank and Statista: Despite the strong correlation between GDP per capita and EPI score, developing countries do not have to abandon sustainability efforts. China for instance leads the world in the adoption of electric vehicle technology.
Post-Pandemic Outlook
Although some rankings can seem prosaic, indexes like the EPI provide a helpful benchmark for economies to compare efforts. It also allows governments to iterate and build upon environmental strategies and investments by highlighting what is and isn’t working. CO2 emissions, for instance, are a major driver of climate change. Although the global economic stall has led to a temporary dip of CO2 emissions in early 2020 (a slower growth rate than the 11% expected rise), global emissions still continue. However, the EPI shows that investments have impact. High-level sustainability efforts—political commitment, media coverage, regulations—can deliver results, even at the grassroots level. on Both figures surpassed analyst expectations by a wide margin, and in January, the unemployment rate hit a 53-year low of 3.4%. With the recent release of February’s numbers, unemployment is now reported at a slightly higher 3.6%. A low unemployment rate is a classic sign of a strong economy. However, as this visualization shows, unemployment often reaches a cyclical low point right before a recession materializes.
Reasons for the Trend
In an interview regarding the January jobs data, U.S. Treasury Secretary Janet Yellen made a bold statement: While there’s nothing wrong with this assessment, the trend we’ve highlighted suggests that Yellen may need to backtrack in the near future. So why do recessions tend to begin after unemployment bottoms out?
The Economic Cycle
The economic cycle refers to the economy’s natural tendency to fluctuate between periods of growth and recession. This can be thought of similarly to the four seasons in a year. An economy expands (spring), reaches a peak (summer), begins to contract (fall), then hits a trough (winter). With this in mind, it’s reasonable to assume that a cyclical low in the unemployment rate (peak employment) is simply a sign that the economy has reached a high point.
Monetary Policy
During periods of low unemployment, employers may have a harder time finding workers. This forces them to offer higher wages, which can contribute to inflation. For context, consider the labor shortage that emerged following the COVID-19 pandemic. We can see that U.S. wage growth (represented by a three-month moving average) has climbed substantially, and has held above 6% since March 2022. The Federal Reserve, whose mandate is to ensure price stability, will take measures to prevent inflation from climbing too far. In practice, this involves raising interest rates, which makes borrowing more expensive and dampens economic activity. Companies are less likely to expand, reducing investment and cutting jobs. Consumers, on the other hand, reduce the amount of large purchases they make. Because of these reactions, some believe that aggressive rate hikes by the Fed can either cause a recession, or make them worse. This is supported by recent research, which found that since 1950, central banks have been unable to slow inflation without a recession occurring shortly after.
Politicians Clash With Economists
The Fed has raised interest rates at an unprecedented pace since March 2022 to combat high inflation. More recently, Fed Chairman Jerome Powell warned that interest rates could be raised even higher than originally expected if inflation continues above target. Senator Elizabeth Warren expressed concern that this would cost Americans their jobs, and ultimately, cause a recession. Powell remains committed to bringing down inflation, but with the recent failures of Silicon Valley Bank and Signature Bank, some analysts believe there could be a pause coming in interest rate hikes. Editor’s note: just after publication of this article, it was confirmed that U.S. interest rates were hiked by 25 basis points (bps) by the Federal Reserve.