GDP per capita has steadily risen globally over time, and in tandem, the standard of living worldwide has increased immensely. This map using data from the IMF shows the GDP per capita (nominal) of nearly every country and territory in the world. GDP per capita is one of the best measures of a country’s wealth as it provides an understanding of how each country’s citizens live on average, showing a representation of the quantity of goods and services created per person.
The Standard of Living Over Time
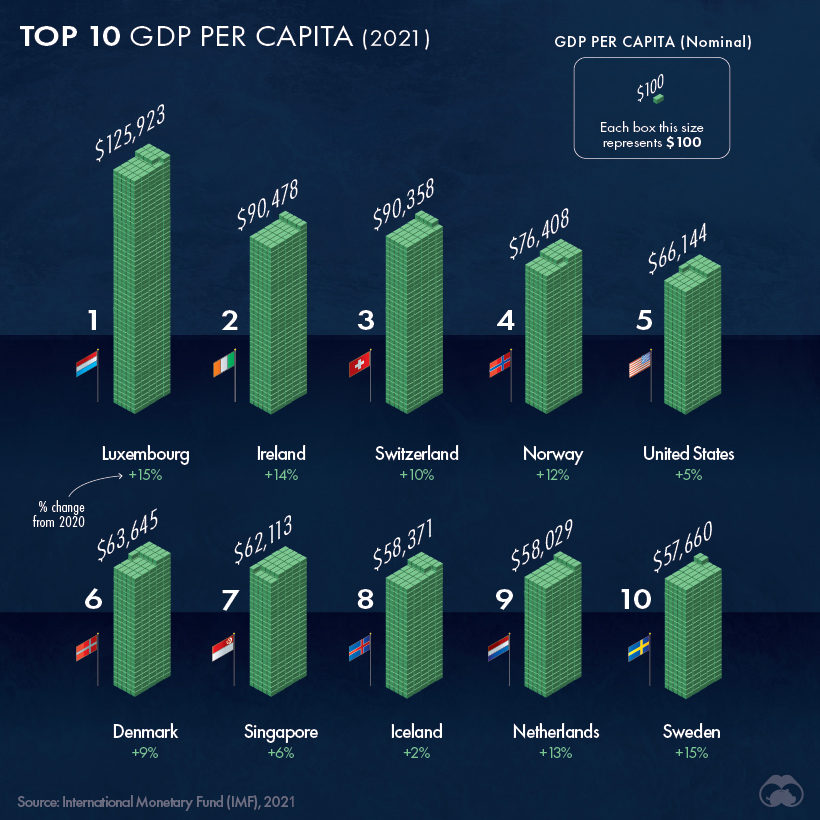
Looking at history, our standard of living has increased drastically. According to Our World in Data, from 1820 to 2018, the average global GDP per capita increased by almost 15x. Literacy rates, access to vaccines, and basic education have also improved our quality of life, while things like child mortality rates and poverty have all decreased. For example, in 1990, 1.9 billion people lived in extreme poverty, which was 36% of the world’s population at the time. Over the last 30 years, the number has been steadily decreasing — by 2030, an estimated 479 million people will be living in extreme poverty, which according to UN population estimates, will represent only 6% of the population. That said, economic inequality between different regions is still prevalent. In fact, the richest country today (in terms of nominal GDP per capita), Luxembourg, is over 471x more wealthy than the poorest, Burundi. Here’s a look at the 10 countries with the highest GDP per capita in 2021:
However, not all citizens in Luxembourg are extremely wealthy. In fact:
29% of people spend over 40% of their income on housing costs 31% would be at risk of falling into poverty if they had to forgo 3 months of income
The cost of living is expensive in Luxembourg — but the standard of living in terms of goods and services produced is the highest in the world. Additionally, only 4% of the population reports low life satisfaction.
Emerging Economies and Developing Countries
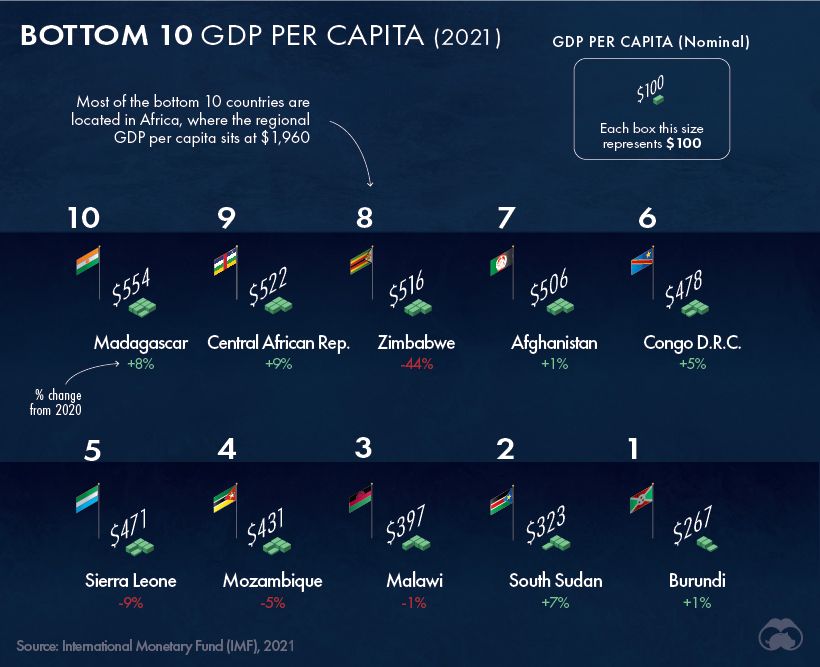
Although we have never lived in a more prosperous period, and poverty rates have been declining overall, this year global extreme poverty rose for the first time in over two decades. About 120 million additional people are living in poverty as a result of the pandemic, with the total expected to rise to about 150 million by the end of 2021. Many of the poorest countries in the world are also considered Least Developed Countries (LDCs) by the UN. In these countries, more than 75% of the population live below the poverty line. Here’s a look at the 10 countries with the lowest GDP per capita:
Life in these countries offers a stark contrast compared to the top 10. Here’s a glance at the quality of life in the poorest country, Burundi:
80% of the population works in agriculture 1 in 3 Burundians are in need of urgent humanitarian assistance Average households spend up to two-thirds of their income on food
However, many of the world’s poorest countries can also be classified as emerging markets with immense economic potential in the future. In fact, China has seen the opportunity in emerging economies. Their confidence in these regions is best exemplified in the Belt and Road initiative which has funneled massive investments into infrastructure projects across multiple African countries.
Continually Raising the Bar
Prosperity is a very recent reality only characterizing the last couple hundred years. In pre-modern societies, the average person was living in conditions that would be considered extreme poverty by today’s standards. Overall, the standard of living for everyone today is immensely improved compared to even recent history, and some countries will be experiencing rapid economic growth in the future.
GDP per Capita in 2021: Full Dataset
Editor’s note: Readers have rightly pointed out that Monaco is one of the world’s richest countries in GDP per capita (nominal) terms. This is true, but the IMF dataset excludes Monaco and lists it as “No data” each year. As a result, it is excluded from the visualization(s) above. on Last year, stock and bond returns tumbled after the Federal Reserve hiked interest rates at the fastest speed in 40 years. It was the first time in decades that both asset classes posted negative annual investment returns in tandem. Over four decades, this has happened 2.4% of the time across any 12-month rolling period. To look at how various stock and bond asset allocations have performed over history—and their broader correlations—the above graphic charts their best, worst, and average returns, using data from Vanguard.
How Has Asset Allocation Impacted Returns?
Based on data between 1926 and 2019, the table below looks at the spectrum of market returns of different asset allocations:
We can see that a portfolio made entirely of stocks returned 10.3% on average, the highest across all asset allocations. Of course, this came with wider return variance, hitting an annual low of -43% and a high of 54%.
A traditional 60/40 portfolio—which has lost its luster in recent years as low interest rates have led to lower bond returns—saw an average historical return of 8.8%. As interest rates have climbed in recent years, this may widen its appeal once again as bond returns may rise.
Meanwhile, a 100% bond portfolio averaged 5.3% in annual returns over the period. Bonds typically serve as a hedge against portfolio losses thanks to their typically negative historical correlation to stocks.
A Closer Look at Historical Correlations
To understand how 2022 was an outlier in terms of asset correlations we can look at the graphic below:
The last time stocks and bonds moved together in a negative direction was in 1969. At the time, inflation was accelerating and the Fed was hiking interest rates to cool rising costs. In fact, historically, when inflation surges, stocks and bonds have often moved in similar directions. Underscoring this divergence is real interest rate volatility. When real interest rates are a driving force in the market, as we have seen in the last year, it hurts both stock and bond returns. This is because higher interest rates can reduce the future cash flows of these investments. Adding another layer is the level of risk appetite among investors. When the economic outlook is uncertain and interest rate volatility is high, investors are more likely to take risk off their portfolios and demand higher returns for taking on higher risk. This can push down equity and bond prices. On the other hand, if the economic outlook is positive, investors may be willing to take on more risk, in turn potentially boosting equity prices.
Current Investment Returns in Context
Today, financial markets are seeing sharp swings as the ripple effects of higher interest rates are sinking in. For investors, historical data provides insight on long-term asset allocation trends. Over the last century, cycles of high interest rates have come and gone. Both equity and bond investment returns have been resilient for investors who stay the course.