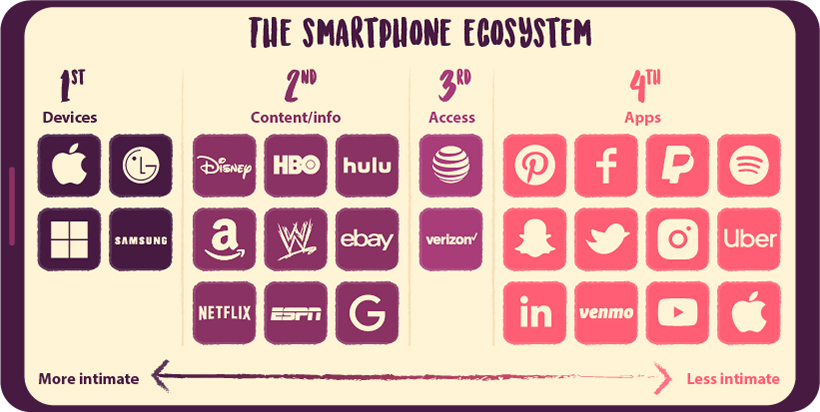
Since March of this year, the COVID-19 pandemic has forced millions of people to physically distance themselves from others, yet many feel closer to their loved ones than ever before. When it comes to brands, consumers have forged relationships that could be just as meaningful. In fact, consumers demonstrated a 23% increase in the number of brands they have an emotional connection with—so what does this mean for brands? The graphic above highlights data from MBLM’s Brand Intimacy COVID Study which measures how emotionally connected consumers in the U.S. are to the brands they use, and how brands can benefit.
The Power of Love
While attracting eyeballs or increasing foot traffic may carry a lot of weight when it comes to determining the success of certain brands, the real metric that should be paid attention to is love. Brands that nurture emotional bonds with their customers tend to outperform top companies listed on the S&P 500 and Fortune 500 in both revenue and profit. Not only that, they can also build higher levels of trust, which in turn breeds a more loyal consumer base over time. —MBLM Managing Partner, Mario Natarelli As the global pandemic rages on, this idea has become more relevant than ever before. Consumers have been using their newfound time to deepen their relationship with brands, but who has managed to win their hearts?
Brand Love in the Time of COVID-19
The list of most loved brands has seen three new additions throughout the year: Google, YouTube, and Toyota, which means that media and entertainment brands now dominate the list. The retail industry has also increased intimacy score performance by 9.4% during the pandemic, with Walmart flying the flag for retail brands in fourth place.
The Formula for a Happy Relationship
When it comes to giving consumers what they want, Apple ticks the box for three important need states highlighted in the report:
Fulfilment: A brand that exceeds expectations by delivering on superior service, quality, and efficacy. Ritual: When a person ingrains a brand into his or her daily actions, it becomes a vitally important part of their everyday life. Enhancement: Customers become better through use of the brand—smarter, more capable, and more connected.
Interestingly, brands that are part of the smartphone ecosystem generally outperform brands that are not, and the ecosystem has only increased in strength during the pandemic. Moreover, brands that fall into the “devices” or “content/information” categories have higher intimacy scores, and are therefore more loved.
There has also been an increase in the performance of brands in the “access” category—such as Verizon and AT&T—which may be attributed to the value people are placing on communication during the pandemic.
Notable Mentions
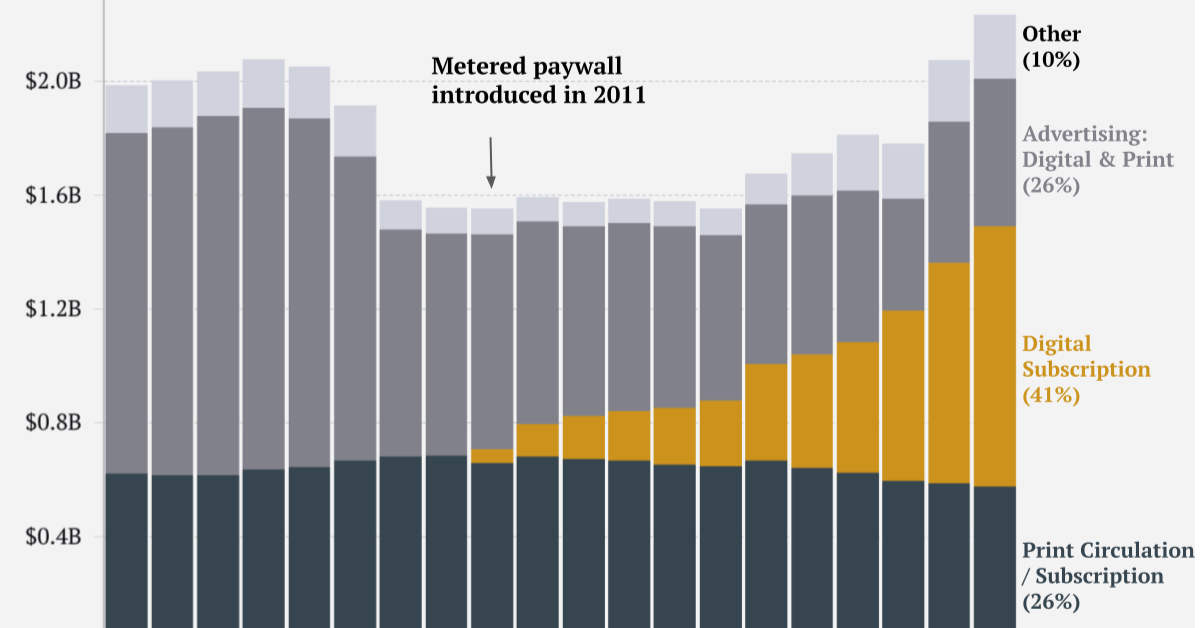
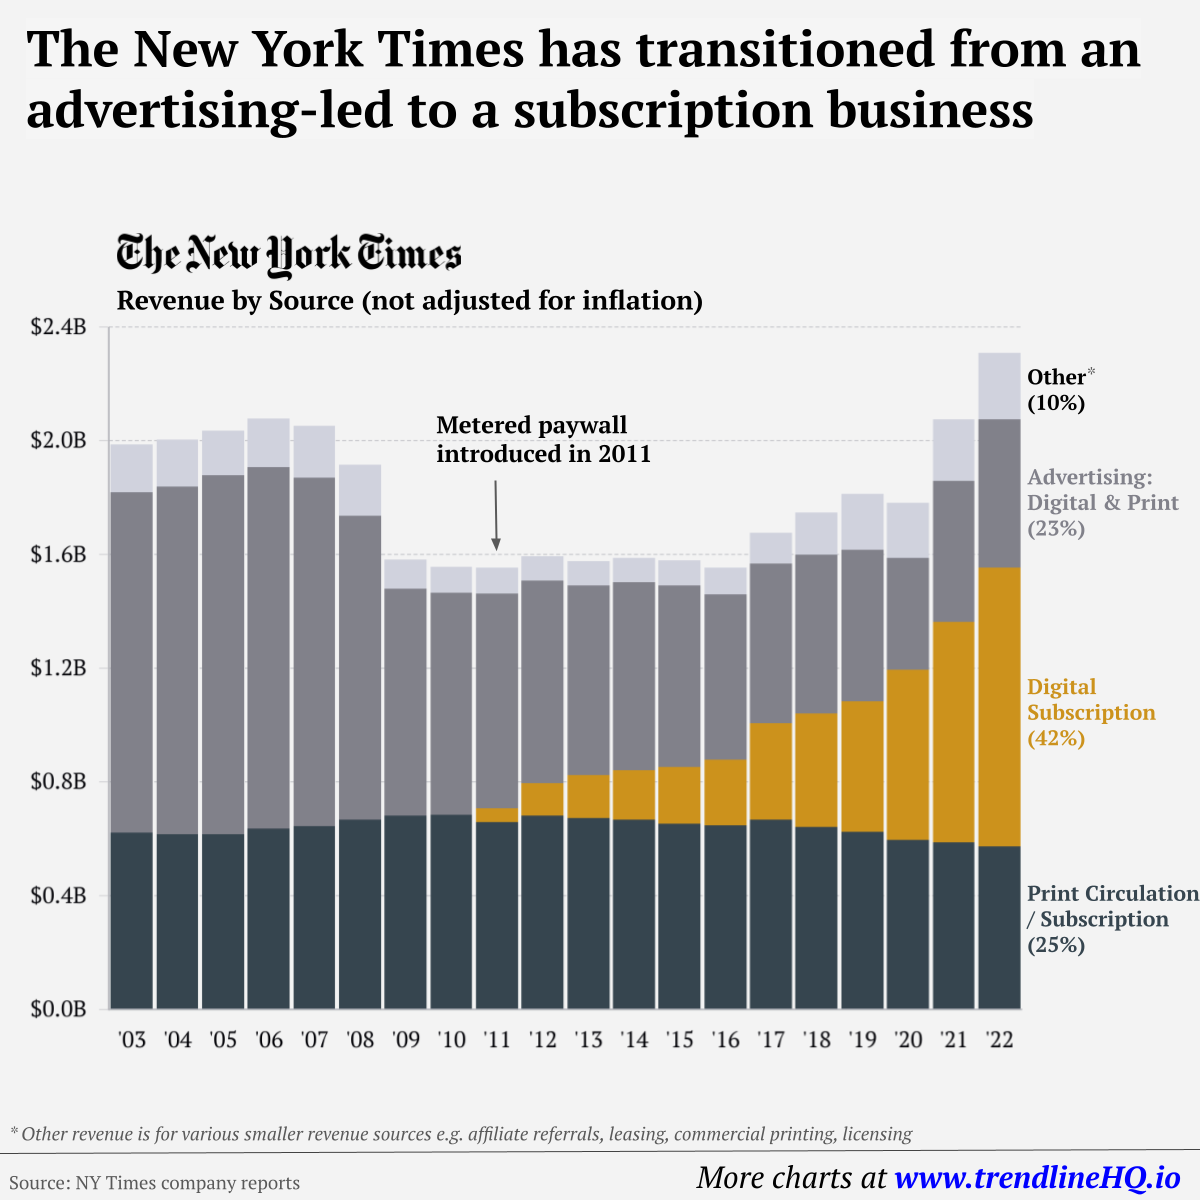
It’s also worth noting that consumers have increased their usage of virtual conferencing brand Zoom more than any other brand in the study. While hand sanitizer brand Purell did not make the list of most loved brands, it ranked in first place when it comes to the best response to the pandemic and is the brand consumers are most willing to pay 20% more for. Overall, it is clear that COVID-19 has had a huge influence on the brands that consumers connect with most. With their preferences now leaning towards brands in the smartphone ecosystem, one has to wonder: will marketers of the future place more value on winning the hearts of consumers, or simply getting in their hands? on Similar to the the precedent set by the music industry, many news outlets have also been figuring out how to transition into a paid digital monetization model. Over the past decade or so, The New York Times (NY Times)—one of the world’s most iconic and widely read news organizations—has been transforming its revenue model to fit this trend. This chart from creator Trendline uses annual reports from the The New York Times Company to visualize how this seemingly simple transition helped the organization adapt to the digital era.
The New York Times’ Revenue Transition
The NY Times has always been one of the world’s most-widely circulated papers. Before the launch of its digital subscription model, it earned half its revenue from print and online advertisements. The rest of its income came in through circulation and other avenues including licensing, referrals, commercial printing, events, and so on. But after annual revenues dropped by more than $500 million from 2006 to 2010, something had to change. In 2011, the NY Times launched its new digital subscription model and put some of its online articles behind a paywall. It bet that consumers would be willing to pay for quality content. And while it faced a rocky start, with revenue through print circulation and advertising slowly dwindling and some consumers frustrated that once-available content was now paywalled, its income through digital subscriptions began to climb. After digital subscription revenues first launched in 2011, they totaled to $47 million of revenue in their first year. By 2022 they had climbed to $979 million and accounted for 42% of total revenue.
Why Are Readers Paying for News?
More than half of U.S. adults subscribe to the news in some format. That (perhaps surprisingly) includes around four out of 10 adults under the age of 35. One of the main reasons cited for this was the consistency of publications in covering a variety of news topics. And given the NY Times’ popularity, it’s no surprise that it recently ranked as the most popular news subscription.
