You may have seen diamond hands, rockets, and r/wallstreetbets rallying cries in the past few weeks—but what does it all mean? In this graphic we explain the events that led to an explosive rise in GameStop’s share price, along with the Reddit revolution fueling it. Gamestop’s stock has been on a wild roller coaster ride, rising by roughly 640% from the start of last week to its peak. After Robinhood and other brokers initializing trading restrictions due to the heightened market activity, the stock has since fallen more than 80% to $90 per share. But the stock’s volatile price action doesn’t come close to telling the story of how this market frenzy began on the Reddit community r/wallstreetbets, the hedge funds that suffered when GameStop share price rose dramatically, and why Robinhood halted trading last week.
The Beginning of the GameStop Saga
While GameStop’s share price went higher than anyone expected this past week, the initial idea behind this rally was shared back in September 2019 by u/DeepFuckingValue, a frequent user in the r/wallstreetbets subreddit, a community where trade and investment ideas are shared. The premise of his trade idea was simple: he saw unrecognized value and much more upside potential compared to the downside risk in GameStop. While people were eager to proclaim the death of physical game sales, u/DeepFuckingValue noted the new generation of consoles on the horizon would bring gamers back to GameStop. Along with the company’s new board of directors and solid balance sheet, GameStop wasn’t as poorly positioned as many thought. Among those betting against the company were a variety of hedge funds and other players who had an outstanding short interest against the stock. Just like the legendary investor Michael Burry proposed after him, u/DeepFuckingValue noted the possibility of a short squeeze if GameStop’s share price moved higher.
GameStop Rockets to the Moon
A collection of shorts had amassed on the game retailer’s stock, with hedge funds like Melvin Capital Management holding onto shorts for multiple years despite GME being at all-time lows. The r/wallstreetbets community caught onto this high short interest and wanted to “squeeze” them out of their positions. In August and September of 2020, GameStop broke up from its lows around $4 a share, and returned 66% and 53% respectively, reaching new highs of $11 a share. Hedge funds piled in further as short interest on publicly traded shares reached 120%, yet GameStop’s uptrend continued, reaching more than $20 a share by the end of December. Here’s what’s happened since: Sources: TradingView, /u/DeepFuckingValue’s Reddit posts As GameStop’s price ran into the triple digits by the end of January, Melvin Capital was forced to close their short position despite a $2.75B investment from Citadel and Point72. At the same time, in just a few weeks, the number of r/wallstreetbets subscribers shot up from 1.8M to 8.3M.
Robinhood Halts Trading and Institutes Position Limits
On January 28th, when GameStop shares reached highs above $460, Robinhood and other brokers halted purchases of GameStop shares and options along with the ability to purchase fractional shares of securities. The broker had received a bill from the NSCC (National Securities Clearing Corporation) of $3B, reflective of the high volatility and value at risk on the platform. In an informal interview with Elon Musk on Clubhouse, Robinhood CEO Vlad Tenev said that halting purchases and instituting position limits allowed the bill’s cost to ultimately drop to $700M. Before this interview, the company published a blog post of what happened on their end, along with an explainer of how trades are settled with clearinghouses. While position limits which limited the amount of shares and options users could buy had originally been placed on 51 different securities, today only five have position limits. These include r/wallstreetbets favorites like GameStop (GME), AMC Entertainment (AMC), and Nokia (NOK).
Robinhood’s New Position Limits
You can see the latest position limits on Robinhood’s platform here. Along with these position limits, Robinhood has instated further limitations related to pattern day traders. This limits users with less than $25,000 in their account to fewer than four trades over five business days.
r/wallstreetbets Discovers Dogecoin and Eyes Silver Shorts
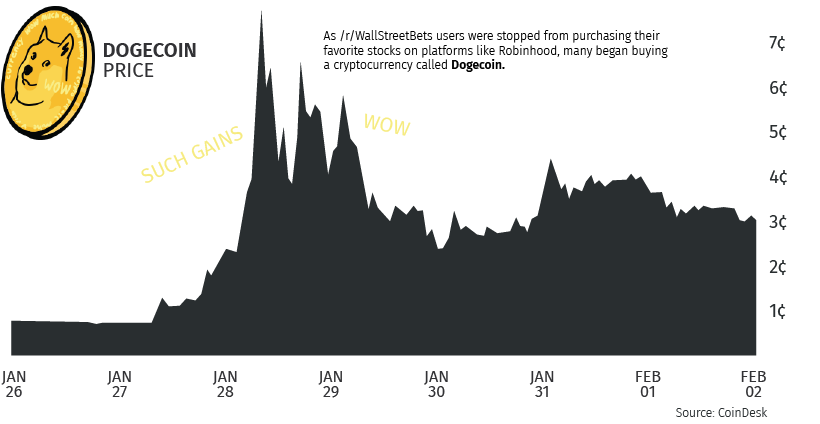
As buying was halted for many of the preferred r/wallstreetbets stocks, the community shifted its attention to the cryptocurrency Dogecoin. Prior to the 28th, Dogecoin had been trading for $0.007 a coin, but in less than 24 hours the coin rose 1,000% to a high of $0.086. Following this, the meme-based cryptocurrency has since levelled off around $0.033, which is still nearly a 350% return for anyone who had bought before the 28th.
Since their foray into cryptocurrency, some r/wallstreetbets users have now identified silver as a new opportunity with short squeeze potential. Since the 28th, silver has risen about 5%. Increased volumes for various silver brokers caused delays or resulted in the suspension of silver purchases over the weekend. Despite the rally and growing excitement around the precious metal, there are those in the r/wallstreetbets community who consider this a distraction. Malicious players with a short interest in GameStop may be trying to draw attention away from the GameStop short squeeze.
What’s Next for Robinhood and r/wallstreetbets?
Since these unprecedented market events, Robinhood raised $3.4B in an investment round to further support their goal of “expanding everyday investors’ ability to invest”. Yet the company faces dozens of lawsuits for their halting of share purchases on the 28th of January, and will likely have to put its IPO on the backburner. Their decision to halt purchases ultimately removed large amounts of buy pressure from GameStop and other securities, and its newly instated position limits and pattern day trader rule have driven many users away from the platform. With their actions, Robinhood unwittingly spurred a deep divide between Main Street and Wall Street. Many r/wallstreetbets members now feel their trades and investments carry an idealistic importance worth more than potential profits or losses. While there is still plenty of this story left to play out, last week saw an irreversible change in how many individual investors perceive the market, its participants, and its rules. While new rules and regulations will change shape going forward, one thing is clear: the rise of information sharing has changed how financial markets will be traded forever. on Last year, stock and bond returns tumbled after the Federal Reserve hiked interest rates at the fastest speed in 40 years. It was the first time in decades that both asset classes posted negative annual investment returns in tandem. Over four decades, this has happened 2.4% of the time across any 12-month rolling period. To look at how various stock and bond asset allocations have performed over history—and their broader correlations—the above graphic charts their best, worst, and average returns, using data from Vanguard.
How Has Asset Allocation Impacted Returns?
Based on data between 1926 and 2019, the table below looks at the spectrum of market returns of different asset allocations:
We can see that a portfolio made entirely of stocks returned 10.3% on average, the highest across all asset allocations. Of course, this came with wider return variance, hitting an annual low of -43% and a high of 54%.
A traditional 60/40 portfolio—which has lost its luster in recent years as low interest rates have led to lower bond returns—saw an average historical return of 8.8%. As interest rates have climbed in recent years, this may widen its appeal once again as bond returns may rise.
Meanwhile, a 100% bond portfolio averaged 5.3% in annual returns over the period. Bonds typically serve as a hedge against portfolio losses thanks to their typically negative historical correlation to stocks.
A Closer Look at Historical Correlations
To understand how 2022 was an outlier in terms of asset correlations we can look at the graphic below:
The last time stocks and bonds moved together in a negative direction was in 1969. At the time, inflation was accelerating and the Fed was hiking interest rates to cool rising costs. In fact, historically, when inflation surges, stocks and bonds have often moved in similar directions. Underscoring this divergence is real interest rate volatility. When real interest rates are a driving force in the market, as we have seen in the last year, it hurts both stock and bond returns. This is because higher interest rates can reduce the future cash flows of these investments. Adding another layer is the level of risk appetite among investors. When the economic outlook is uncertain and interest rate volatility is high, investors are more likely to take risk off their portfolios and demand higher returns for taking on higher risk. This can push down equity and bond prices. On the other hand, if the economic outlook is positive, investors may be willing to take on more risk, in turn potentially boosting equity prices.
Current Investment Returns in Context
Today, financial markets are seeing sharp swings as the ripple effects of higher interest rates are sinking in. For investors, historical data provides insight on long-term asset allocation trends. Over the last century, cycles of high interest rates have come and gone. Both equity and bond investment returns have been resilient for investors who stay the course.