While these are necessary measures to contain the spread of the COVID-19 pandemic, such economic interruption is unprecedented in many ways—resulting in some surprising side effects.
The Evidence is in NO₂ Emissions
Nitrogen dioxide (NO₂) emissions, a major air pollutant, are closely linked to factory output and vehicles operating on the road. As both industry and transport come to a halt during this pandemic, NO₂ emissions can be a good indicator of global economic activity—and the changes are visible from space. These images from the Centre for Research on Energy and Clean Air (CREA), as well as satellite footage from NASA and the European Space Agency (ESA), show a drastic decline in NO₂ emissions over recent months, particularly across Italy and China.
NO₂ Emissions Across Italy
In Italy, the number of active COVID-19 cases has surpassed China (including the death toll). Amid emergency actions to lock down the entire nation, everything from schools and shops, to restaurants and even some churches, are closed. Italy is also an industrial hub, with the sector accounting for nearly 24% of GDP. With many Italians urged to work from home if possible, visible economic activity has dropped considerably. This 10-day moving average animation (from January 1st—March 11th, 2020) of nitrogen dioxide emissions across Europe clearly demonstrates how the drop in Italy’s economic activity has impacted the environment. Source: European Space Agency (ESA) That’s not all: a drop in boat traffic also means that Venice’s canals are clear for the time being, as small fish have begun inhabiting the waterways again. Experts are cautious to note that this does not necessarily mean the water quality is better.
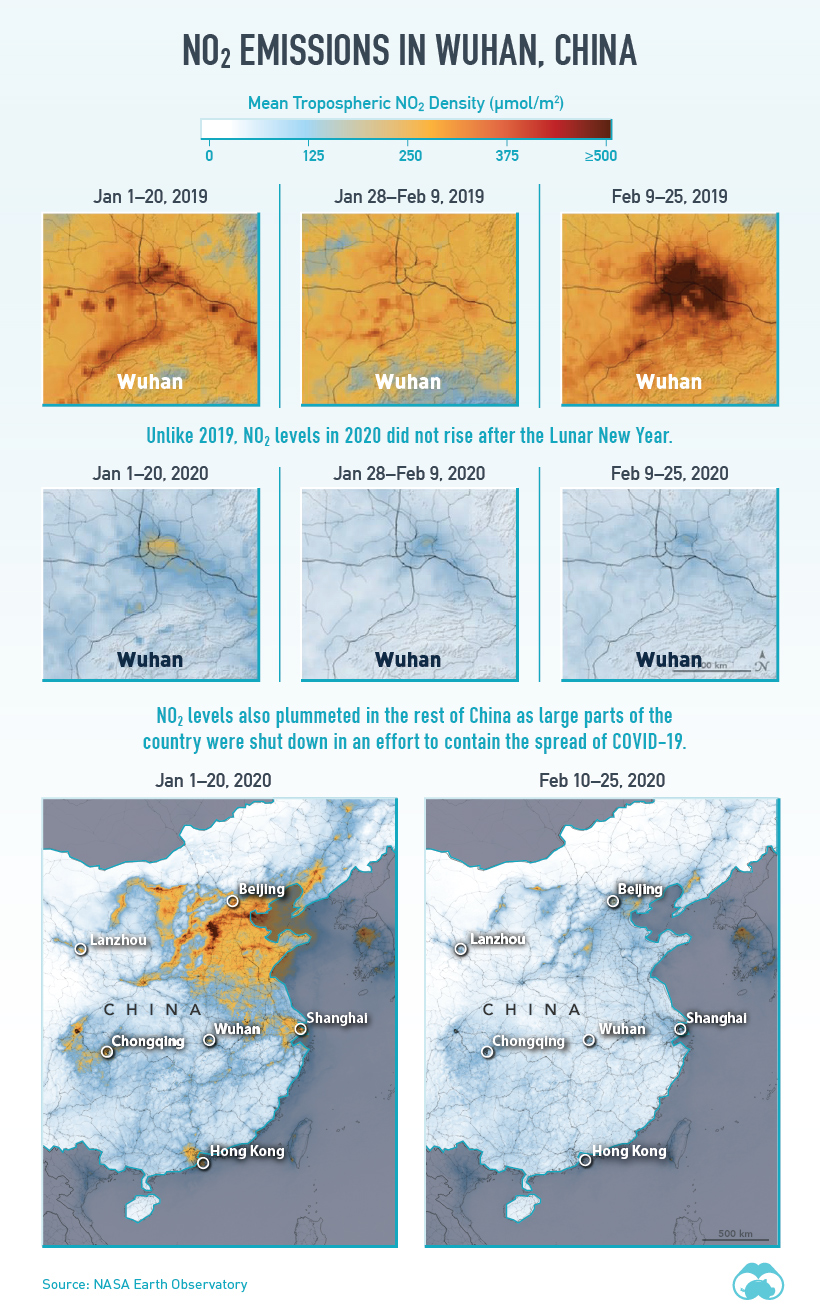
NO₂ Emissions Across China
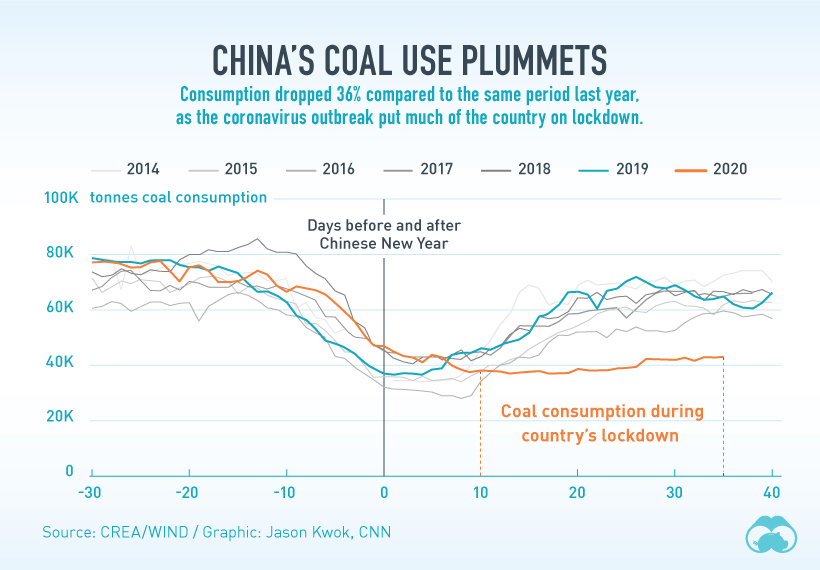
The emissions changes above China are possibly even more obvious to the eye. China is the world’s most important manufacturing hub and a significant contributor to greenhouse gases globally. But in the month following Lunar New Year (a week-long festival in early February), satellite imagery painted a different picture. Source: NASA Earth Observatory NO₂ emissions around the Hubei province, the original epicenter of the virus, steeply dropped as factories were forced to shutter their doors for the time being. What’s more, there were measurable effects in the decline of other emission types from the drop in coal use during the same time, compared to years prior.
Back to the Status Quo?
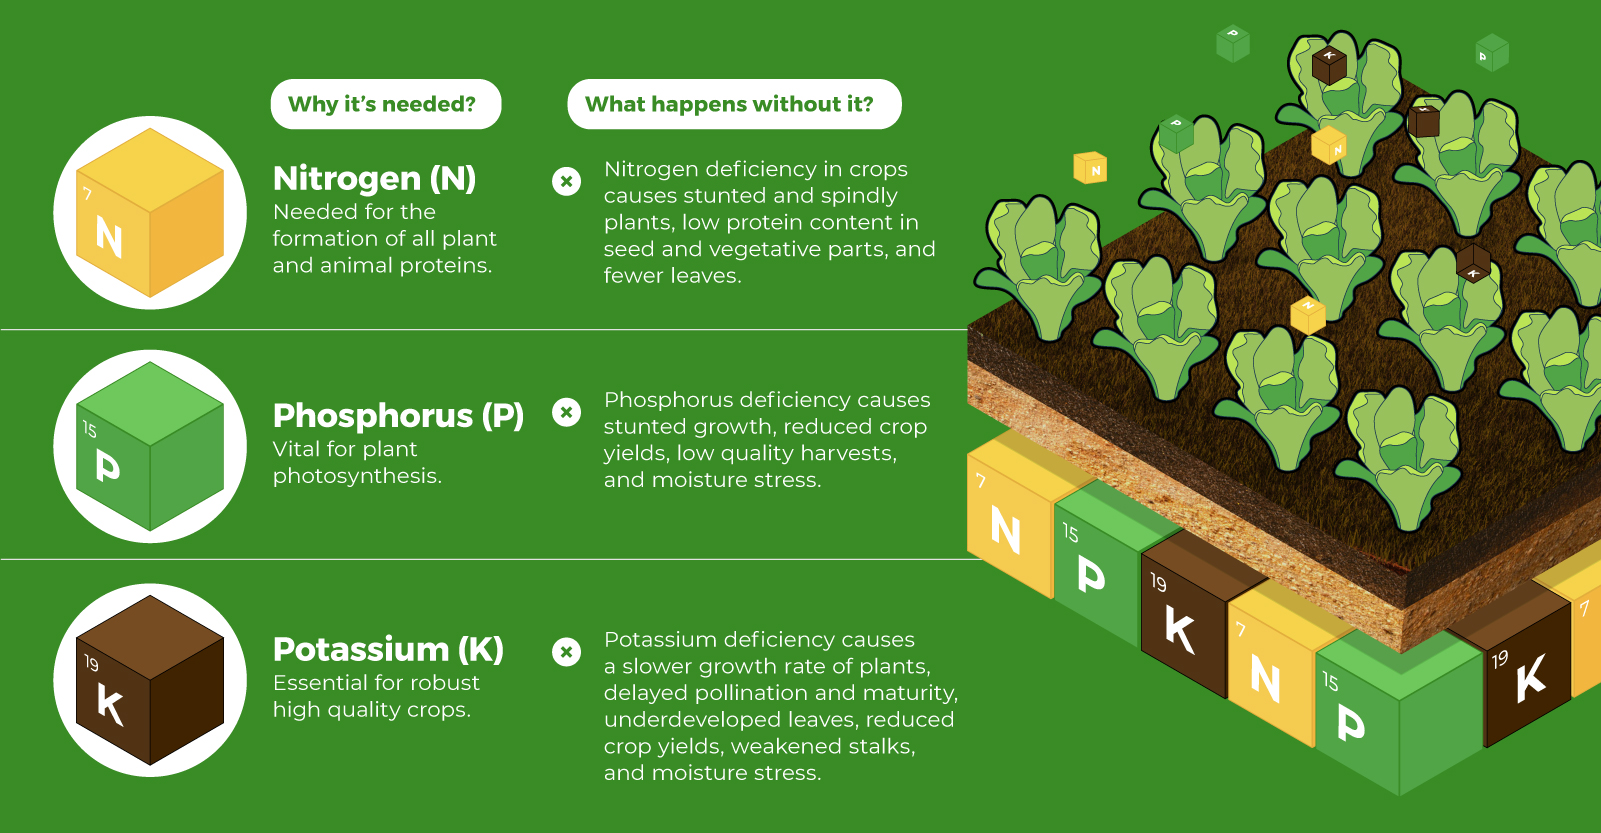
In recent weeks, China has been able to flatten the curve of its total COVID-19 cases. As a result, the government is beginning to ease its restrictions—and it’s clear that social and economic activities are starting to pick back up in March. Source: European Space Agency (ESA) With the regular chain of events beginning to resume, it remains to be seen whether NO₂ emissions will rebound right back to their pre-pandemic levels. —Li Shuo, Senior climate policy advisor, Greenpeace East Asia on Over recent decades, farmers have been able to more than double their production of crops thanks to fertilizers and the vital nutrients they contain. When crops are harvested, the essential nutrients are taken away with them to the dining table, resulting in the depletion of these nutrients in the soil. To replenish these nutrients, fertilizers are needed, and the cycle continues. The above infographic by Brazil Potash shows the role that each macronutrient plays in growing healthy, high-yielding crops.
Food for Growth
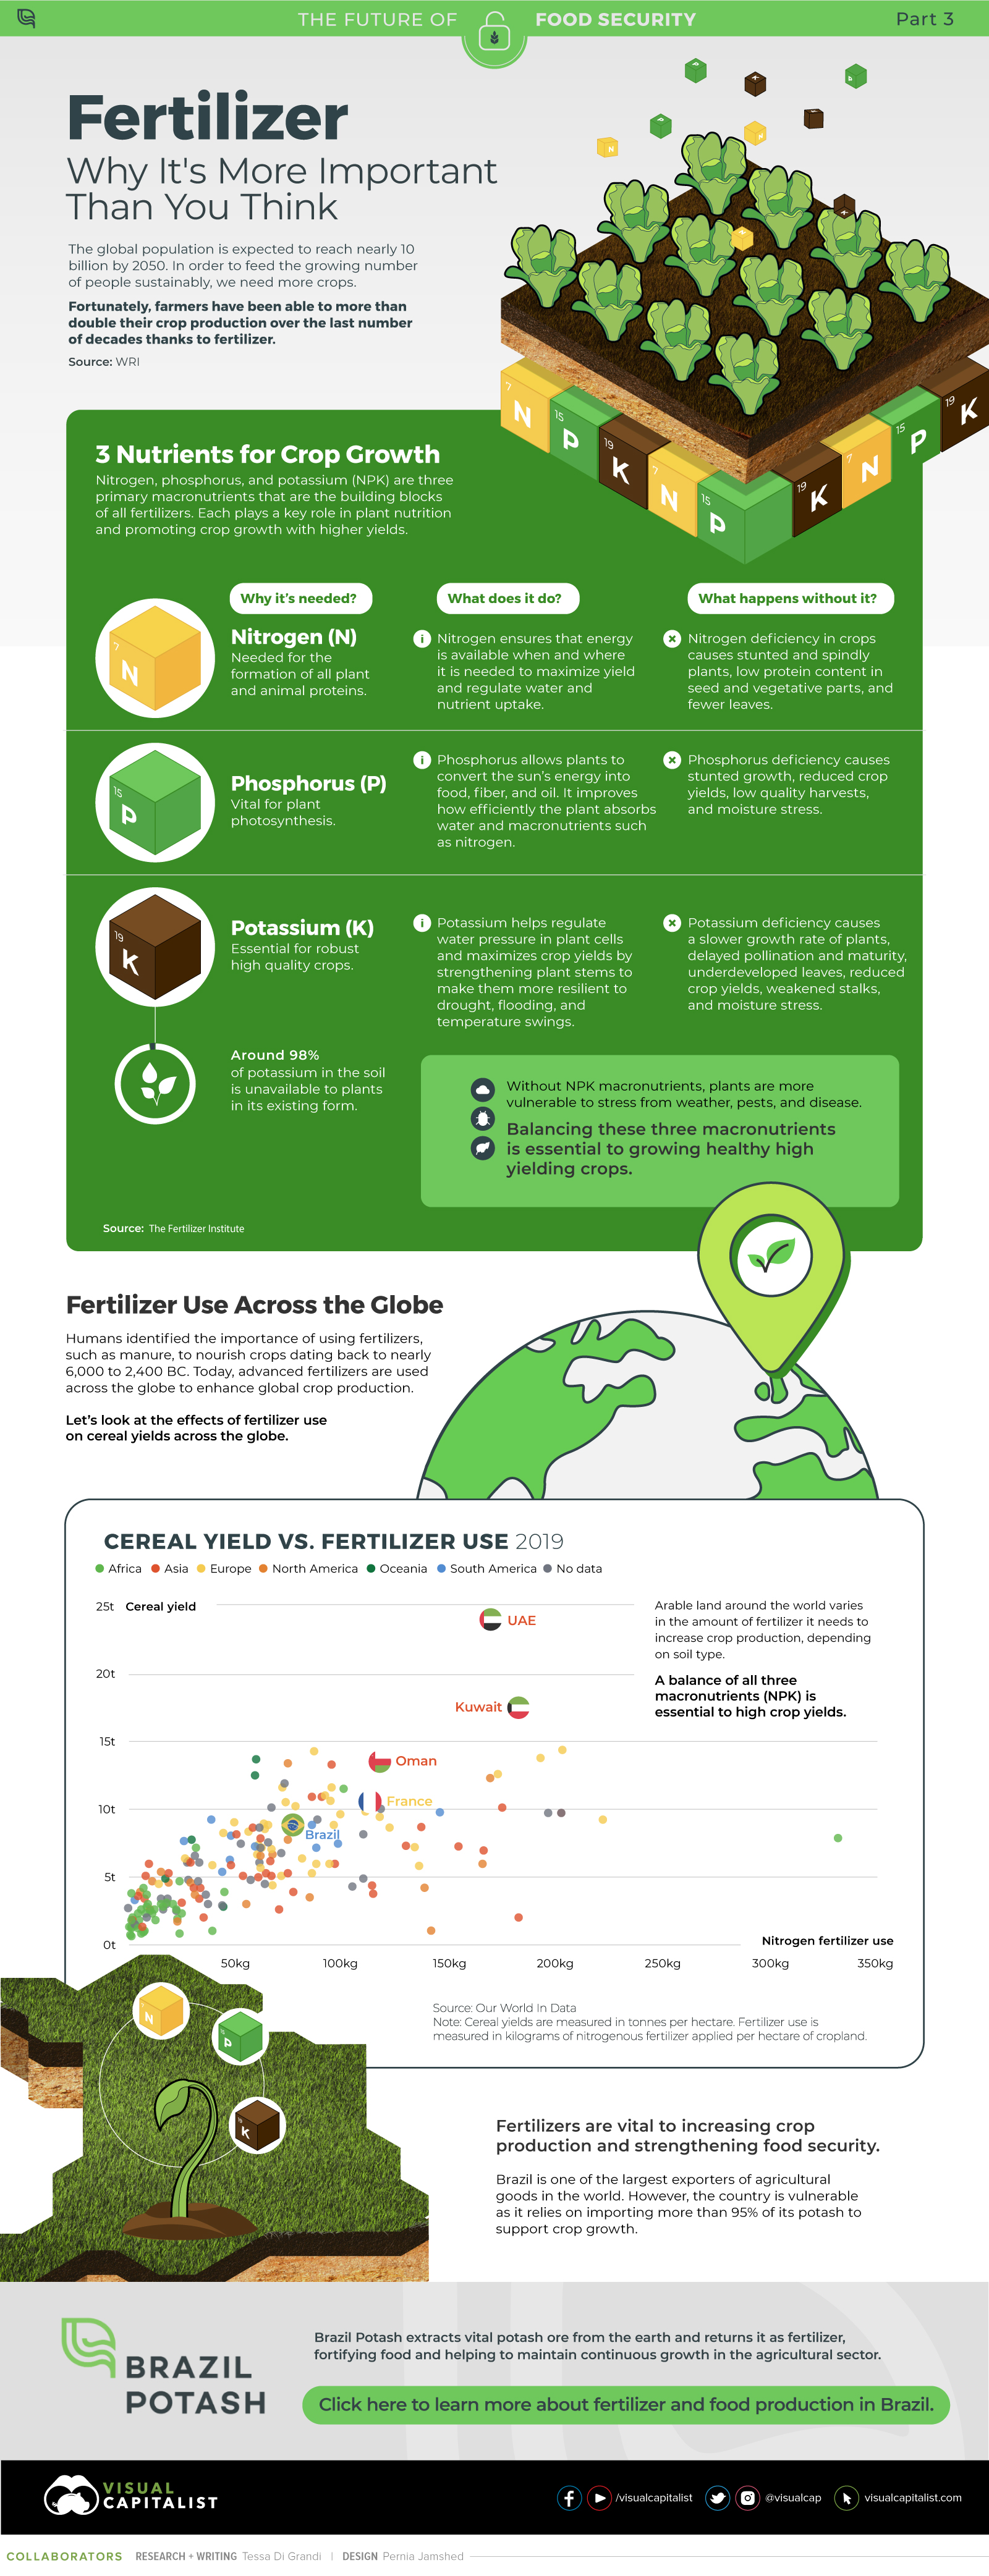
Nitrogen, phosphorus, and potassium (NPK) are three primary macronutrients that are the building blocks of the global fertilizer industry. Each plays a key role in plant nutrition and promoting crop growth with higher yields. Let’s take a look at how each macronutrient affects plant growth. If crops lack NPK macronutrients, they become vulnerable to various stresses caused by weather conditions, pests, and diseases. Therefore, it is crucial to maintain a balance of all three macronutrients for the production of healthy, high-yielding crops.
The Importance of Fertilizers
Humans identified the importance of using fertilizers, such as manure, to nourish crops dating back to nearly 6,000 to 2,400 BC. As agriculture became more intensive and large-scale, farmers began to experiment with different types of fertilizers. Today advanced chemical fertilizers are used across the globe to enhance global crop production. There are a myriad of factors that affect soil type, and so the farmable land must have a healthy balance of all three macronutrients to support high-yielding, healthy crops. Consequently, arable land around the world varies in the amount and type of fertilizer it needs. Fertilizers play an integral role in strengthening food security, and a supply of locally available fertilizer is needed in supporting global food systems in an ever-growing world. Brazil is one of the largest exporters of agricultural goods in the world. However, the country is vulnerable as it relies on importing more than 95% of its potash to support crop growth. Brazil Potash is developing a new potash project in Brazil to ensure a stable domestic source of this nutrient-rich fertilizer critical for global food security. Click here to learn more about fertilizer and food production in Brazil.