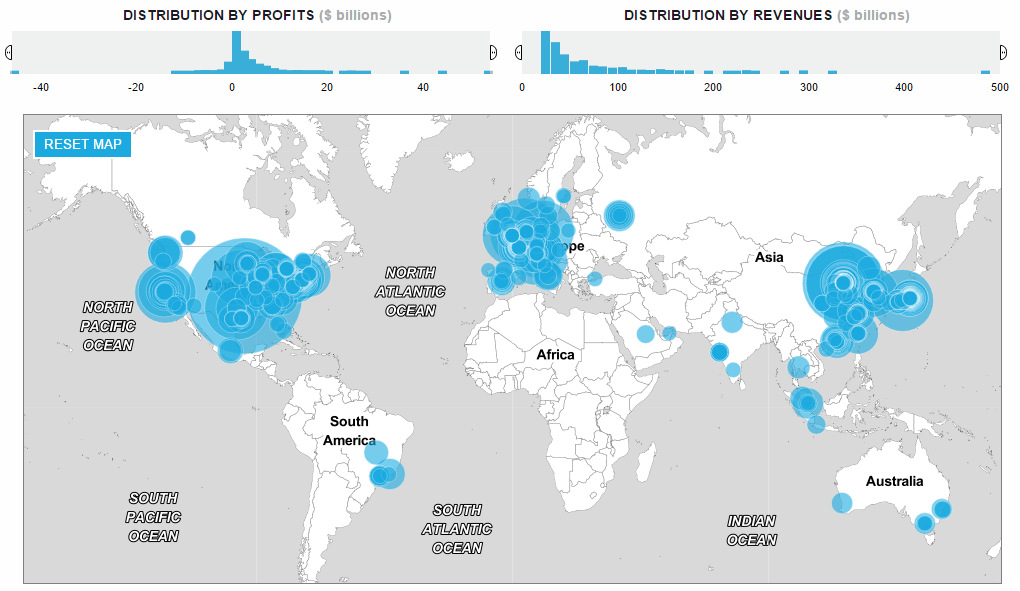
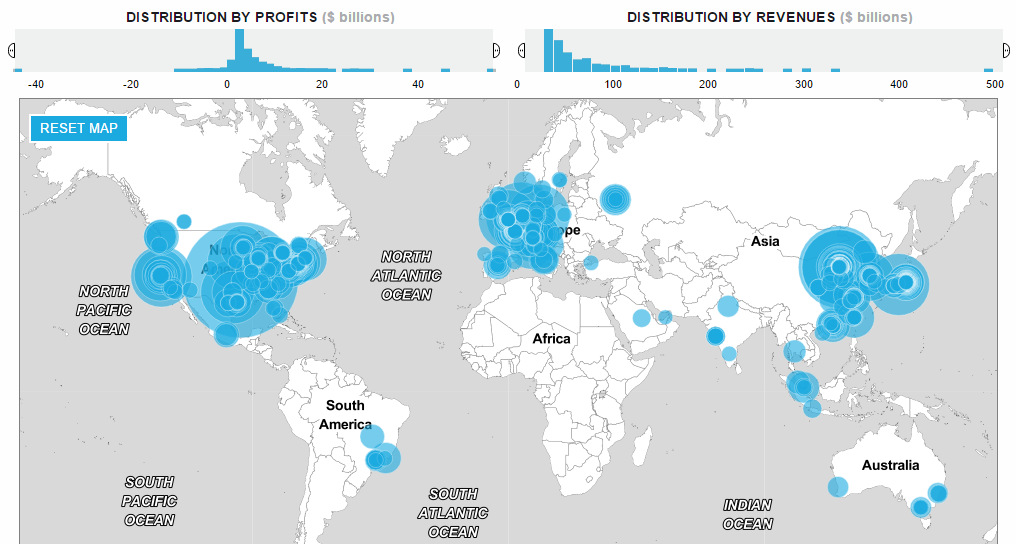
Here’s the companies on the 2016 edition mapped based on the location of their headquarters. The size of each circle is equivalent to the most recent revenue number:
As you can see, companies are mostly concentrated in the United States, China, Japan, and the EU. Here’s the exact breakdown:
United States: 134 China: 103 Japan: 52 France: 29 Germany: 28 United Kingdom: 28 South Korea: 26 Switzerland: 15 Netherlands: 12 Canada: 11 Other: 75
The biggest company by revenue? It’s Walmart, and it has a circle that takes up the whole continental United States on the map. That circle represents its annual revenues of $482 billion. But the real question isn’t which company is the biggest – what’s much more interesting is to look at the rankings data to see what interesting stories can be told.
Movers and Shakers on the Fortune Global 500 List
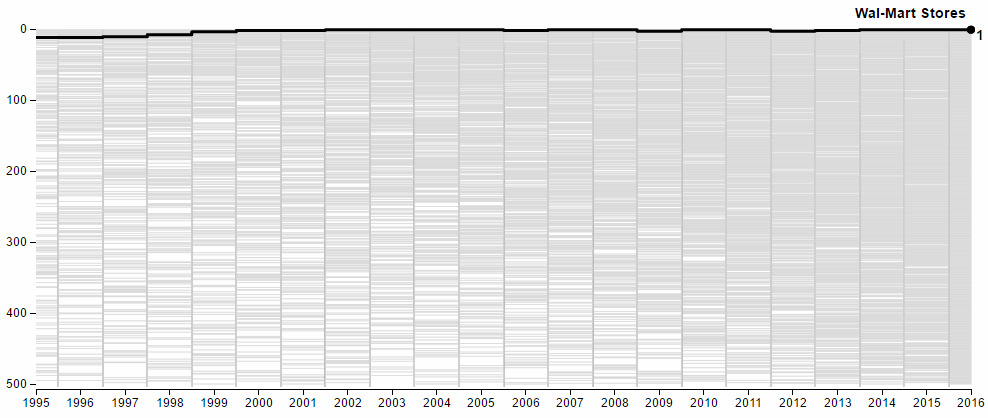
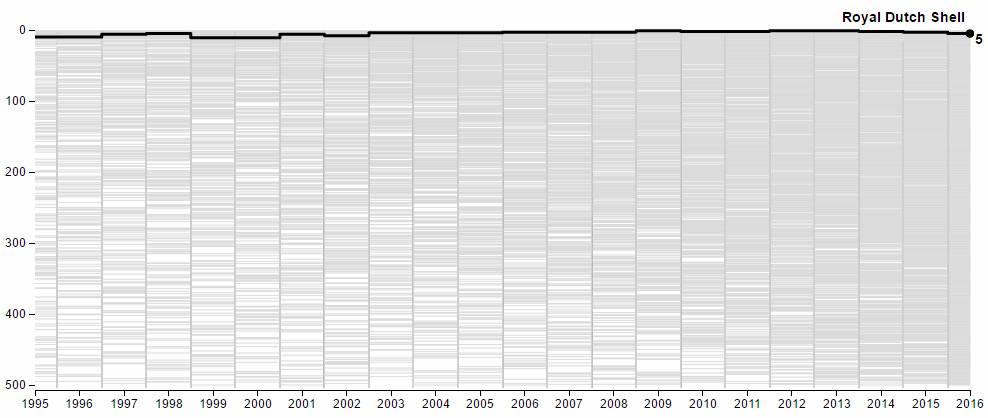
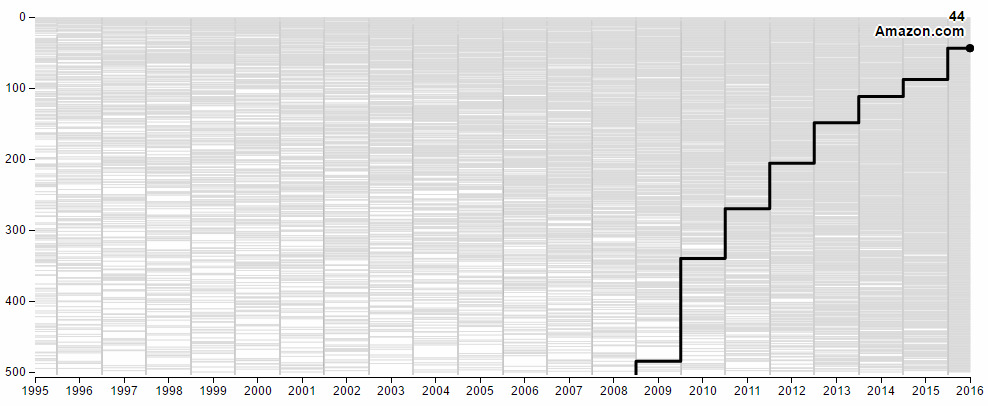
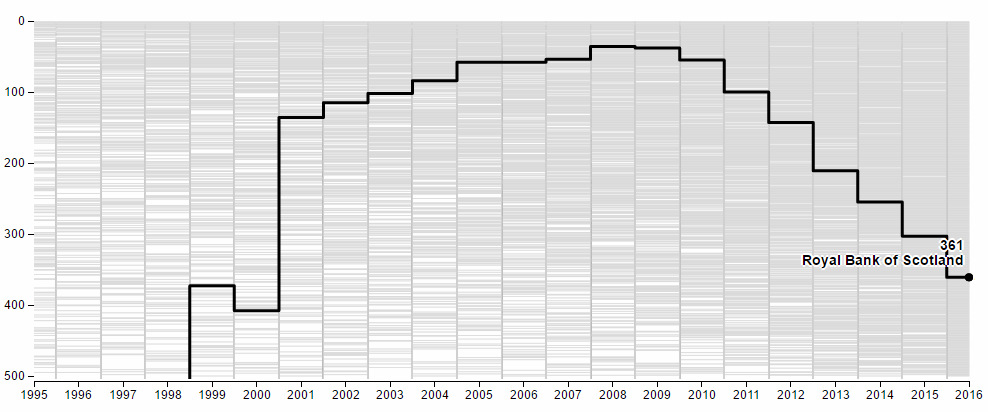
How have companies on the list today performed over the last 20 years? Companies such as Walmart or Royal Dutch Shell have been remarkably consistent blue chips:
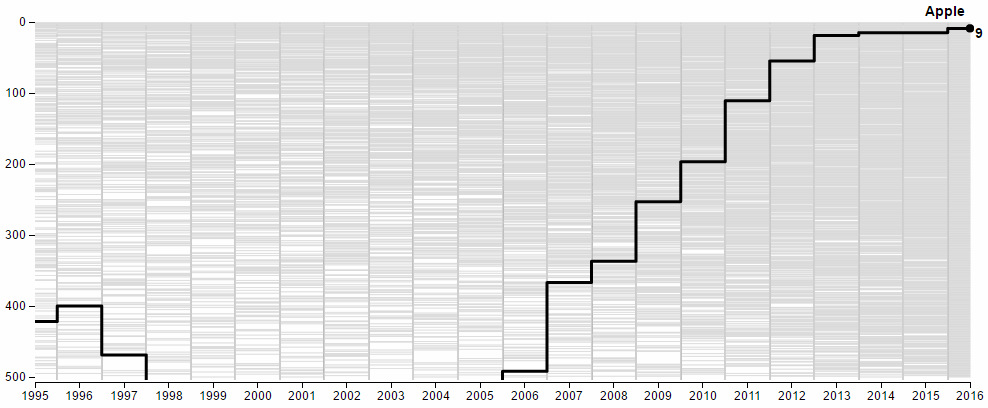
Other companies are not so consistent. They have ups and downs, and here the rankings data helps to tell their tales. For example, you can see the “Dark Ages” of Apple in the following graph after they fired Steve Jobs. The company spent 12 years without him, and you can see that by 1997 they were almost off the Fortune Global 500 list. Apple acquired NeXT in 1997 and Jobs would regain the title of CEO. Ten years later, the iPhone was released and the company soared back into the Top 10.
But Apple isn’t the only company that is a mover or shaker.
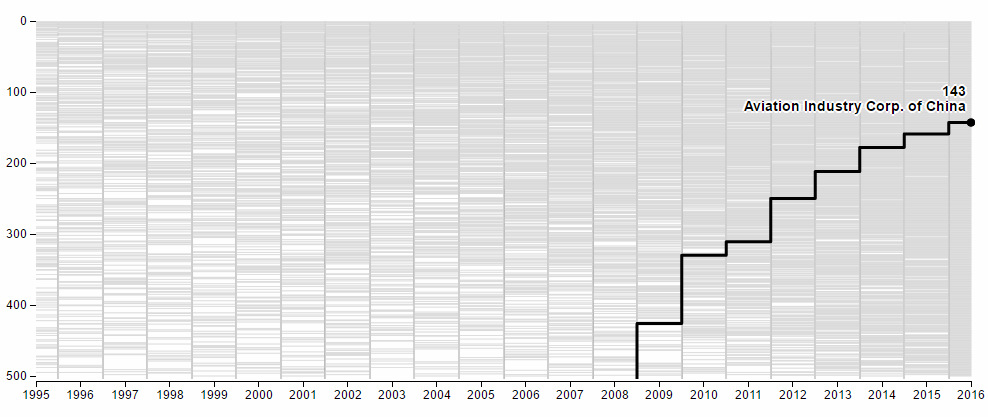
There are many newer entries on the list from China, and it seems that almost every one has a trajectory similar to this:
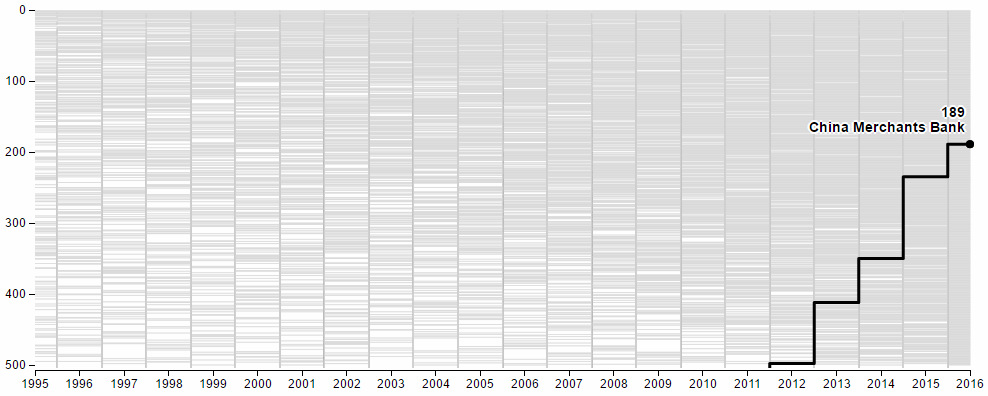
What does the state-sponsored Aviation Industry Corp. of China do, exactly? The company’s 542,236 employees build planes – lots of planes. Particularly, they seem to build fighter jets, bombers, drones, and even entire airports. Here’s another skyrocketing Chinese company. This time it is the China Merchants Bank:
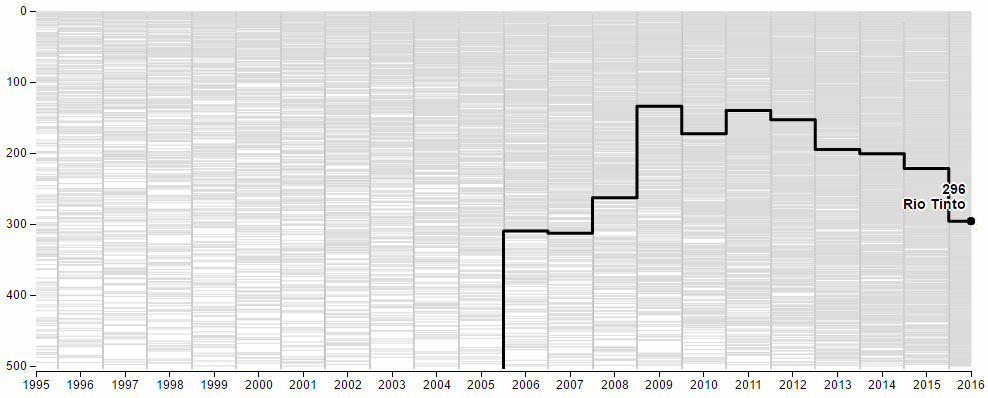
Meanwhile, the effects of the recent commodity downturn can be seen in the trajectories of companies such as Rio Tinto:
And the chart for the Royal Bank of Scotland shows how it was affected by the 2009 Financial Crisis:
If you haven’t already, we recommend checking out the full interactive piece by Fortune.
on The good news is that the Federal Reserve, U.S. Treasury, and Federal Deposit Insurance Corporation are taking action to restore confidence and take the appropriate measures to help provide stability in the market. With this in mind, the above infographic from New York Life Investments looks at the factors that impact bonds, how different types of bonds have historically performed across market environments, and the current bond market volatility in a broader context.
Bond Market Returns
Bonds had a historic year in 2022, posting one of the worst returns ever recorded. As interest rates rose at the fastest pace in 40 years, it pushed bond prices lower due to their inverse relationship. In a rare year, bonds dropped 13%.
Source: FactSet, 01/02/2023.
Bond prices are only one part of a bond’s total return—the other looks at the income a bond provides. As interest rates have increased in the last year, it has driven higher bond yields in 2023.
Source: YCharts, 3/20/2023.
With this recent performance in mind, let’s look at some other key factors that impact the bond market.
Factors Impacting Bond Markets
Interest rates play a central role in bond market dynamics. This is because they affect a bond’s price. When rates are rising, existing bonds with lower rates are less valuable and prices decline. When rates are dropping, existing bonds with higher rates are more valuable and their prices rise. In March, the Federal Reserve raised rates 25 basis points to fall within the 4.75%-5.00% range, a level not seen since September 2007. Here are projections for where the federal funds rate is headed in 2023:
Federal Reserve Projection*: 5.1% Economist Projections**: 5.3%
*Based on median estimates in the March summary of quarterly economic projections.**Projections based on March 10-15 Bloomberg economist survey. Together, interest rates and the macroenvironment can have a positive or negative effect on bonds.
Positive
Here are three variables that may affect bond prices in a positive direction:
Lower Inflation: Reduces likelihood of interest rate hikes. Lower Interest Rates: When rates are falling, bond prices are typically higher. Recession: Can prompt a cut in interest rates, boosting bond prices.
Negative
On the other hand, here are variables that may negatively impact bond prices:
Higher Inflation: Can increase the likelihood of the Federal Reserve to raise interest rates. Rising Interest Rates: Interest rate hikes lead bond prices to fall. Weaker Fundamentals: When a bond’s credit risk gets worse, its price can drop. Credit risk indicates the chance of a default, the risk of a bond issuer not making interest payments within a given time period.
Bonds have been impacted by these negative factors since inflation started rising in March 2021.
Fixed Income Opportunities
Below, we show the types of bonds that have had the best performance during rising rates and recessions.
Source: Derek Horstmeyer, George Mason University 12/3/2022. As we can see, U.S. ultrashort bonds performed the best during rising rates. Mortgage bonds outperformed during recessions, averaging 11.4% returns, but with higher volatility. U.S. long-term bonds had 7.7% average returns, the best across all market conditions. In fact, they were also a close second during recessions. When rates are rising, ultrashort bonds allow investors to capture higher rates when they mature, often with lower historical volatility.
A Closer Look at Bond Market Volatility
While bond market volatility has jumped this year, current dislocations may provide investment opportunities. Bond dislocations allow investors to buy at lower prices, factoring in that the fundamental quality of the bond remains strong. With this in mind, here are two areas of the bond market that may provide opportunities for investors:
Investment-Grade Corporate Bonds: Higher credit quality makes them potentially less vulnerable to increasing interest rates. Intermediate Bonds (2-10 Years): Allow investors to lock in higher rates.
Both types of bonds focus on quality and capturing higher yields when faced with challenging market conditions.
Finding the Upside
Much of the volatility seen in the banking sector was due to banks buying bonds during the pandemic—or even earlier—at a time when interest rates were historically low. Since then, rates have climbed considerably. Should rates moderate or stop increasing, this may present better market conditions for bonds. In this way, today’s steep discount in bond markets may present an attractive opportunity for price appreciation. At the same time, investors can potentially lock in strong yields as inflation may subside in the coming years ahead. Learn more about bond investing strategies with New York Life Investments.