Both precious metals and cash serve as safe haven assets, intended to limit losses during market turmoil. However, while modern currencies can be printed by central governments, precious metals derive value from their scarcity. In this infographic from Texas Precious Metals, we compare the value of the world’s gold and silver coin production to global money creation.
Total Production Per Person, 2019
We calculated the value of global currency issuance in 2019 as well as precious metal coins minted, and divided by the global population to get total production per person. Throughout, global money supply is a proxy based on the 5 largest reserve currencies: the U.S. dollar, Euro, Japanese Yen, Sterling Pound, and Chinese Renminbi. All numbers are in USD according to exchange rates as of December 31 2019. Gold and silver values are based on the 2019 year close price of $1,510.60 and $17.90 respectively. The value of new global money supply was 390 times higher than the value of gold coins minted, and 2,400 times higher than silver coins minted. Put another way, for each ounce of minted gold coin, the global money supply increased by more than $593,000.
Change in Annual Production, 2019 vs. 2010
Compared to the start of the decade, here’s how annual production levels have changed: Annual increases to global money supply have increased by half, far outpacing the change in the world’s gold and silver coin production. Even more recently, how has production changed during the COVID-19 pandemic?
The COVID-19 Effect
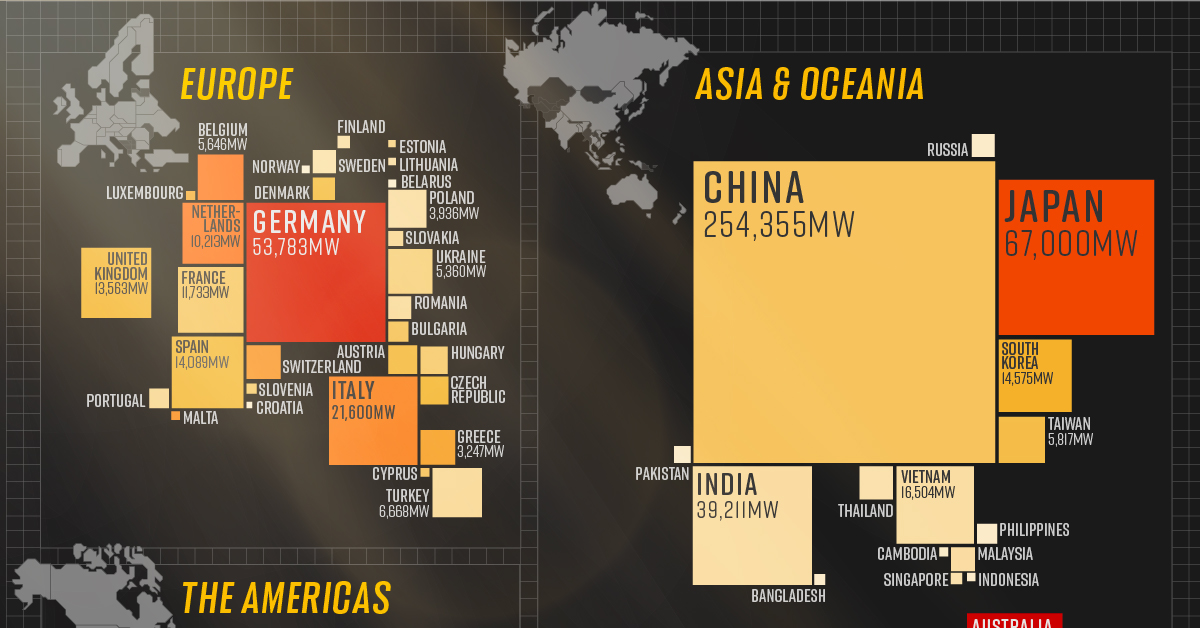
In response to the global pandemic, central banks have enacted numerous measures to help support economies—including issuing new currency. The global money supply increased by more than $6.8 trillion in the first half of 2020. In fact, the value of printed currency was 930 times higher than the value of minted gold coins over the same timeframe. Investors may want to consider which asset is more vulnerable to inflation as they look to protect their portfolios. Want to learn more? See the U.S. version of this graphic. on The world is adopting renewable energy at an unprecedented pace, and solar power is the energy source leading the way. Despite a 4.5% fall in global energy demand in 2020, renewable energy technologies showed promising progress. While the growth in renewables was strong across the board, solar power led from the front with 127 gigawatts installed in 2020, its largest-ever annual capacity expansion. The above infographic uses data from the International Renewable Energy Agency (IRENA) to map solar power capacity by country in 2021. This includes both solar photovoltaic (PV) and concentrated solar power capacity.
The Solar Power Leaderboard
From the Americas to Oceania, countries in virtually every continent (except Antarctica) added more solar to their mix last year. Here’s a snapshot of solar power capacity by country at the beginning of 2021: *1 megawatt = 1,000,000 watts. China is the undisputed leader in solar installations, with over 35% of global capacity. What’s more, the country is showing no signs of slowing down. It has the world’s largest wind and solar project in the pipeline, which could add another 400,000MW to its clean energy capacity. Following China from afar is the U.S., which recently surpassed 100,000MW of solar power capacity after installing another 50,000MW in the first three months of 2021. Annual solar growth in the U.S. has averaged an impressive 42% over the last decade. Policies like the solar investment tax credit, which offers a 26% tax credit on residential and commercial solar systems, have helped propel the industry forward. Although Australia hosts a fraction of China’s solar capacity, it tops the per capita rankings due to its relatively low population of 26 million people. The Australian continent receives the highest amount of solar radiation of any continent, and over 30% of Australian households now have rooftop solar PV systems.
China: The Solar Champion
In 2020, President Xi Jinping stated that China aims to be carbon neutral by 2060, and the country is taking steps to get there. China is a leader in the solar industry, and it seems to have cracked the code for the entire solar supply chain. In 2019, Chinese firms produced 66% of the world’s polysilicon, the initial building block of silicon-based photovoltaic (PV) panels. Furthermore, more than three-quarters of solar cells came from China, along with 72% of the world’s PV panels. With that said, it’s no surprise that 5 of the world’s 10 largest solar parks are in China, and it will likely continue to build more as it transitions to carbon neutrality.
What’s Driving the Rush for Solar Power?
The energy transition is a major factor in the rise of renewables, but solar’s growth is partly due to how cheap it has become over time. Solar energy costs have fallen exponentially over the last decade, and it’s now the cheapest source of new energy generation. Since 2010, the cost of solar power has seen a 85% decrease, down from $0.28 to $0.04 per kWh. According to MIT researchers, economies of scale have been the single-largest factor in continuing the cost decline for the last decade. In other words, as the world installed and made more solar panels, production became cheaper and more efficient. This year, solar costs are rising due to supply chain issues, but the rise is likely to be temporary as bottlenecks resolve.