Treasury bond yields hover near record lows, and U.S. companies face restrictions on issuing dividends if they accept COVID-19 stimulus funds. Moreover, Goldman Sachs estimates dividends for S&P 500 stocks will decline by 25% this year. Which stocks can investors turn to for stable distributions and relatively high dividend yields? Today’s visualization shows 35 stocks that may meet this criteria, leveraging Goldman Sachs data as published by Forbes.
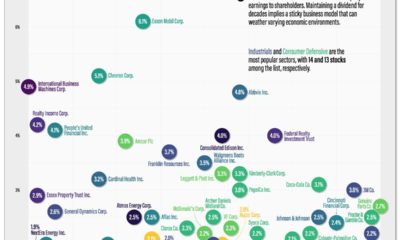
The Dividend Stocks to Watch
To compile the list, Goldman Sachs identified stocks from the Russell 1000 index that met a number of requirements:
A minimum annualized dividend yield of 3% An S&P credit rating of at least BBB+ Ample cash on hand Strong balance sheets ”Reasonable” payout ratios At least average performance since the market peak
Dividend yields, which measure dividend income in relation to the share price, were initially calculated March 27. We have updated them as of market close on April 8. Here’s the full breakdown, sorted from highest to lowest dividend yield:
Note: From the original list, 5 stocks have been excluded as they no longer meet the 3% annualized yield threshold.
Centerpoint Energy, an electric and natural gas utility company, is at the top of the list. Since utility stocks are generally considered to be recession-resistant, investors may benefit from both the company’s yield and its defensive qualities.
Financials are the most-represented sector, with 11 companies on the list. Although regulators have pressured European banks to suspend dividend payments, U.S. banks will likely be able to continue their distributions. Top banking executives have argued they have sufficient capital to weather the COVID-19 crisis, and that halting payments would be “destabilizing to investors.”
There are also a number of well-known names on the list, including Home Depot, IBM, and 3M. The latter is the largest maker of respirator masks worldwide, and has been providing critical supplies to the U.S., Canada, and Latin America.
Caution: Volatility Ahead
As the pandemic’s financial impact continues, it’s likely many companies will delay or suspend their dividends. To avoid falling into “yield traps”—a trap in which an attractive yield could be due to a fundamental business problem—investors can screen for the qualities laid out above. A strong balance sheet, good credit rating, and average or better performance since the downturn can all help point towards stability. on Last year, stock and bond returns tumbled after the Federal Reserve hiked interest rates at the fastest speed in 40 years. It was the first time in decades that both asset classes posted negative annual investment returns in tandem. Over four decades, this has happened 2.4% of the time across any 12-month rolling period. To look at how various stock and bond asset allocations have performed over history—and their broader correlations—the above graphic charts their best, worst, and average returns, using data from Vanguard.
How Has Asset Allocation Impacted Returns?
Based on data between 1926 and 2019, the table below looks at the spectrum of market returns of different asset allocations:
We can see that a portfolio made entirely of stocks returned 10.3% on average, the highest across all asset allocations. Of course, this came with wider return variance, hitting an annual low of -43% and a high of 54%.
A traditional 60/40 portfolio—which has lost its luster in recent years as low interest rates have led to lower bond returns—saw an average historical return of 8.8%. As interest rates have climbed in recent years, this may widen its appeal once again as bond returns may rise.
Meanwhile, a 100% bond portfolio averaged 5.3% in annual returns over the period. Bonds typically serve as a hedge against portfolio losses thanks to their typically negative historical correlation to stocks.
A Closer Look at Historical Correlations
To understand how 2022 was an outlier in terms of asset correlations we can look at the graphic below:
The last time stocks and bonds moved together in a negative direction was in 1969. At the time, inflation was accelerating and the Fed was hiking interest rates to cool rising costs. In fact, historically, when inflation surges, stocks and bonds have often moved in similar directions. Underscoring this divergence is real interest rate volatility. When real interest rates are a driving force in the market, as we have seen in the last year, it hurts both stock and bond returns. This is because higher interest rates can reduce the future cash flows of these investments. Adding another layer is the level of risk appetite among investors. When the economic outlook is uncertain and interest rate volatility is high, investors are more likely to take risk off their portfolios and demand higher returns for taking on higher risk. This can push down equity and bond prices. On the other hand, if the economic outlook is positive, investors may be willing to take on more risk, in turn potentially boosting equity prices.
Current Investment Returns in Context
Today, financial markets are seeing sharp swings as the ripple effects of higher interest rates are sinking in. For investors, historical data provides insight on long-term asset allocation trends. Over the last century, cycles of high interest rates have come and gone. Both equity and bond investment returns have been resilient for investors who stay the course.